![]()
![]()
I set about creating a way to track my own dividend stocks and the response from users have been fantastic. I think that more can benefit from knowing this and know that I will look into ways to improve upon it.
Here are some of the reasons why I think you should give it a try.
It is FREE
Unlike Microsoft Excel, or another paid app, this stock portfolio tracker makes use of Google Spreadsheet.
All you require is a Google Account.
Stock Prices Auto Updates Periodically
Your stock prices gets pulled from Google Finance or Yahoo Finance. The response from Google Finance is faster, while there is a 20 min delay for Yahoo Finance.
This means that you do not have to always key in the latest stock prices!
It tracks international stocks as well as US stocks
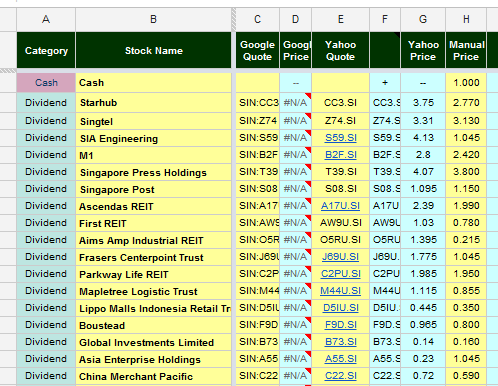

Most stock tracking software are catered more to a US market or a Niche country. Yahoo Finance provides stock prices for many international markets.
If you are able to find the quote on Yahoo Finance you could probably monitor it.
Suited for Long Term Investors
This application is not so much for the traders (though you guys can modify it to your liking) but for long term investors who wants to monitor their stocks through a long period and see their returns and losses at a glance.
Track your Stocks by Transactions
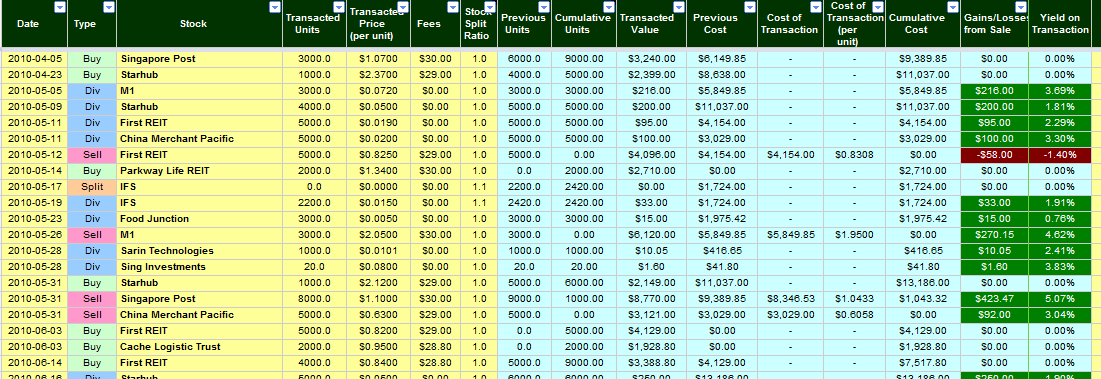
For long term investors, you will have many buys and sells, and you will have a lot of dividends, the occasional stock splits. Wouldn’t it be great if the application tracks by transactions? This application does.
Takes care of many types of transactions
This application enables you to enter buys, sells, dividends, stock splits, rights issues, bonus shares, dividend reinvestments.
No short sell though.
Calculates the average cost of units sold
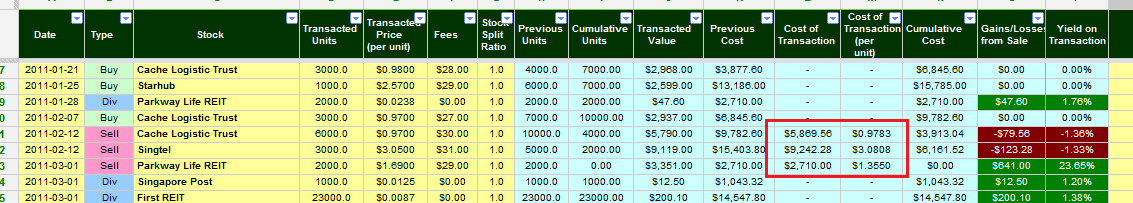
One problem with coming out with your own spreadsheet is you need to figure out how to calculate if you sell 3000 out of 10000 shares what is your average cost. This spreadsheet does that.
Aggregates Gains and Losses of your Transactions, Stock Cost and Current Market Value

The Stock Summary section aggregates the transactions to their stocks. You will be able to see your unrealized gains/losses, realized gains/losses, how much dividends are collected, your current cost on units, current cost and market value.
Compare dividend yield on cost versus current market yield
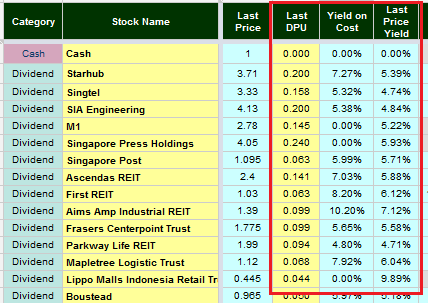

For dividend investors, you may be interested to know what is your average yield on the shares you owned and what is the current yield should you buy it today.
Dividend per share prices are not automatic, but you can grab them off other information portal and input them here.
Review your forecasted dividends collected annually
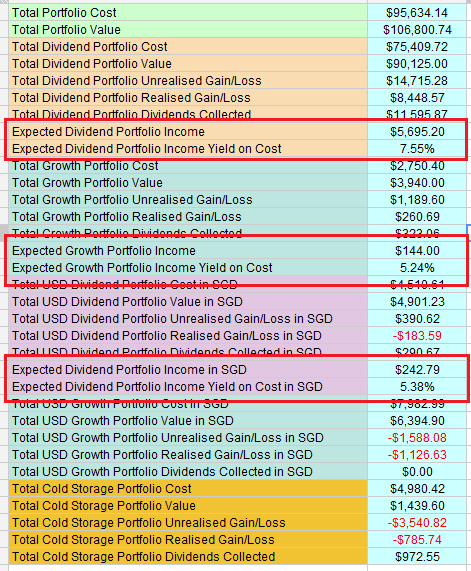
Set up well and you can see at a glance your forecasted dividend returns based on your total yield on cost.
Review your Yearly Gains/Losses and Dividends Collected

You can review your returns by year or by month.
Totally Customizable
If you are an excel or spreadsheet nut, the sky is the limit. I am not really good with spreadsheets but if you are you could even make it better (hope you will share with me how to do it as well!)
Edit it with your spouse, business partner, friends or followers!
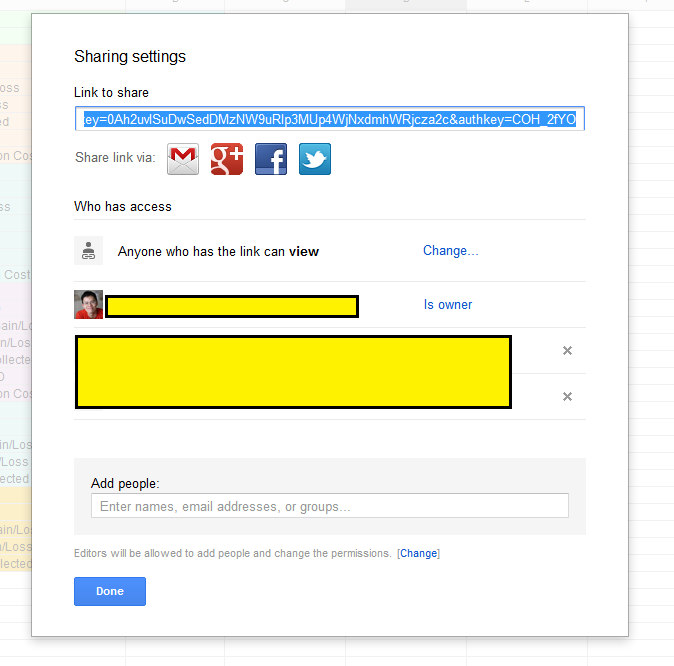

As this is a Google Spreadsheet you can have your spouse and yourself maintain one single portfolio.
The same can be done with business partners as well.
You can set whether they are able to view or edit.
With the Link to Share you can share it with your followers as well
Publish your stock records in different ways!
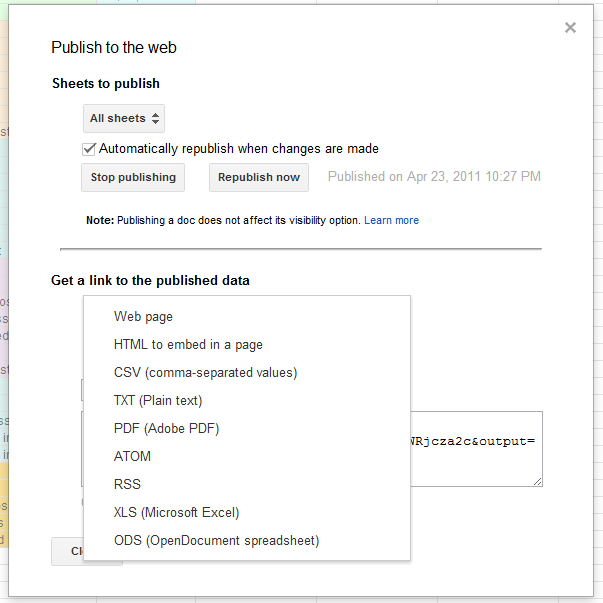

If you are a blogger you can share your records with your readers. If you want to keep hard copy you can do so as well
Publish as a web page. Do not need to login
Google spreadsheet enables you to publish as a website for all to view. If you do not want to always login and view, this is a good medium
https://docs.google.com/spreadsheet/pub?key=0Ah2uvISuDwSedDMzNW9uRlp3MUp4WjNxdmhWRjcza2c&output=html
View it on your phone!
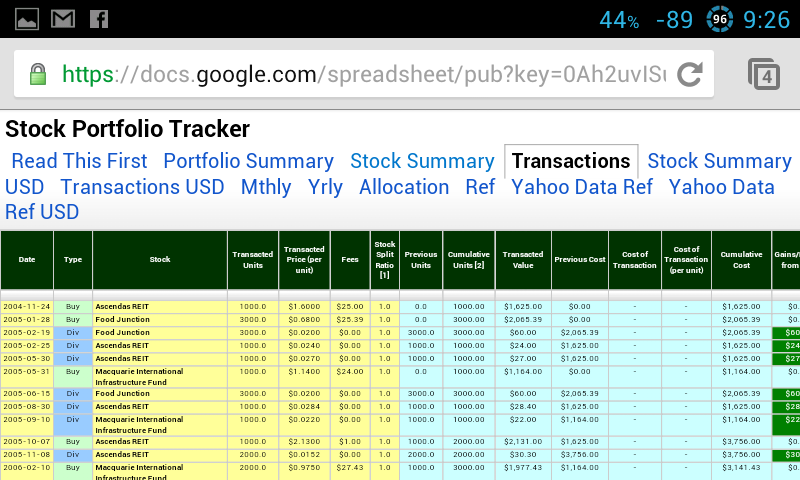
Because you can publish it as a site, you can always quickly view your portfolio at a glance.
Save it as a PDF Report
You can also published it as a PDF report if you want to share with others
Here is a sample report: https://docs.google.com/spreadsheet/pub?key=0Ah2uvISuDwSedDMzNW9uRlp3MUp4WjNxdmhWRjcza2c&output=pdf
How to get it
This stock portfolio tracker can be copied from the original copy.
The detail instructions how to use it can be found in this [article here >]
Conclusion
I will be looking into how to improve it. Users have given me many suggestions. Some of them doable and others are beyond my powers.
Hopefully folks find this useful.
Do up vote this page by Like or Google Plus it.
You may want to read my [best articles here] and my [dividend stock tracker]
Kyith is the Owner and Sole Writer behind Investment Moats. Readers tune in to Investment Moats to learn and build stronger, firmer wealth foundations, how to have a Passive investment strategy, know more about investing in REITs and the nuts and bolts of Active Investing.
Readers also follow Kyith to learn how to plan well for Financial Security and Financial Independence.
Kyith worked as an IT operations engineer from 2004 to 2019. Currently, he works as a Senior Solutions Specialist in Insurance Start-up Havend. All opinions on Investment Moats are his own and does not represent the views of Providend.
You can view Kyith's current portfolio here, which uses his Free Google Stock Portfolio Tracker.
His investment broker of choice is Interactive Brokers, which allows him to invest in securities from different exchanges all over the world, at very low commission rates, without custodian fees, near spot currency rates.
You can read more about Kyith here.
- My Dividend Experience Investing in UCITS iShares iBond Maturing in 2028. - April 23, 2024
- We Invest into Popular Funds When They Are Popular, Exactly When They Started Turning to Shxt. - April 22, 2024
- Meal Prep 2.0 – Cooking Your “Go-to” Meal that You Look Forward to Eating Everyday. - April 21, 2024
John
Saturday 11th of July 2020
how do I start loading stocks
Philip
Friday 27th of March 2020
Looks good Kyith. I'm just starting with it. Do you know whether anyone has adapted it for Australian investments e.g. Imputation/Franking Credits? Is it amenable to use with Bonds and other Fixed Interest assets? (I now see your answer to this in an earlier question.) Thanks in anticipation Philip
Peter Lian
Sunday 14th of January 2018
Thanks for your excellent software. May I clarify with you on the logic of the following issues, please: 1. Do you treat dividends received as INCOME or as a reduction in the cost of investments? 2. If I have 10,000 shares at $10 per share each, and I sell 5,000 shares at $20, do you reduce the cost of the investment to zero (cost 10,000 shares x$10 - 5,000 shares x $20) or do you report the apportioned profit of the 5,000 shares sold and keep the average cost intact?
Thank you so much, depending on the logic, the results will be different, sir.
Kyith
Sunday 14th of January 2018
Hi Peter,
1) i treat it as income and do not reduce the cost 2) the average cost is 10/10000. the cost is not reduced.
Ben
Tuesday 2nd of February 2016
Kyith, Google Finance no longer support stock codes.
Kyith
Wednesday 3rd of February 2016
Hi Ben,
if you look at my hong kong and US sheets, you will notice the stock quotes from google does work. it is just that they stop supporting Singapore SGX. hope that helps.
wa_wa
Sunday 17th of March 2013
This is by far one of the best sheets I have seen. I actually am lucky enough to have access to Bloomberg and run a portfolio in there, but the only major difference I would say would be the ability to track/decompose PnL of FX within a non-USD trade. To also see rolling PnL (for day, week, month, year etc) also really useful.
keep up the excellent work.
Kyith
Saturday 23rd of March 2013
Wow thanks for the complement I must say that is a bit difficult to do. I hope that I am able to come up with an open source version if possible