A response after I published the returns comparison between the S&P 500 and MSCI World index is whether the returns profile will look different if we use the MSCI All Country World Index instead.
If you read IWDA versus VWRA, which compares the returns between the MSCI World (which IWDA tracks) and the MSCI All Country World (which VWRA tracks), you would know there is not much difference between the two.
Another would like to find out if I made a comparison between Dimensional funds and MSCI World. I don’t remember doing one and may do one in the future. Still, I thought, why not find out how the MSCI All Country World stack up against the S&P 500 and a Dimensional reference index that selects stocks systematically in the MSCI All Country World IMI universe?
This article attempts to compare the performance between the dominant S&P 500 against the MSCI All Country World index and the multifactor Dimensional index.
What Does the MSCI All Country World Index Cover?
I will use the MSCI All Country World (ACWI) IMI index to compare against the S&P 500. You can find the factsheet of the index here.
IMI stands for the investable market index. The MSCI ACWI IMI captures the large-cap, mid-cap and small-cap of developed and emerging markets.
The index covers 9,271 companies. This greatly dwarfs MSCI World’s coverage.
The MSCI ACWI IMI exposes you to not just the large-cap in MSCI World but also the small-cap and the emerging markets.
Who is Dimensional Fund Advisers (DFA)?
Long-time readers may hear me mention DFA’s unit trust a few times in the past.
Dimensional is a U.S asset management company with a strong focus on research and advice. I wrote a comprehensive introduction to Dimensional a couple of years ago.
Through Dimensional, you can systematically invest in a very diversified portfolio that leans towards smaller, cheaper and more profitable companies in a low-cost manner.
The appeal of Dimensional is that if your investment philosophy is aligned to them (research-based, not market cap focused, prefers cheaper and profitable companies), they can be your hands and legs in execution, delegating your time away from the execution of your portfolio management.
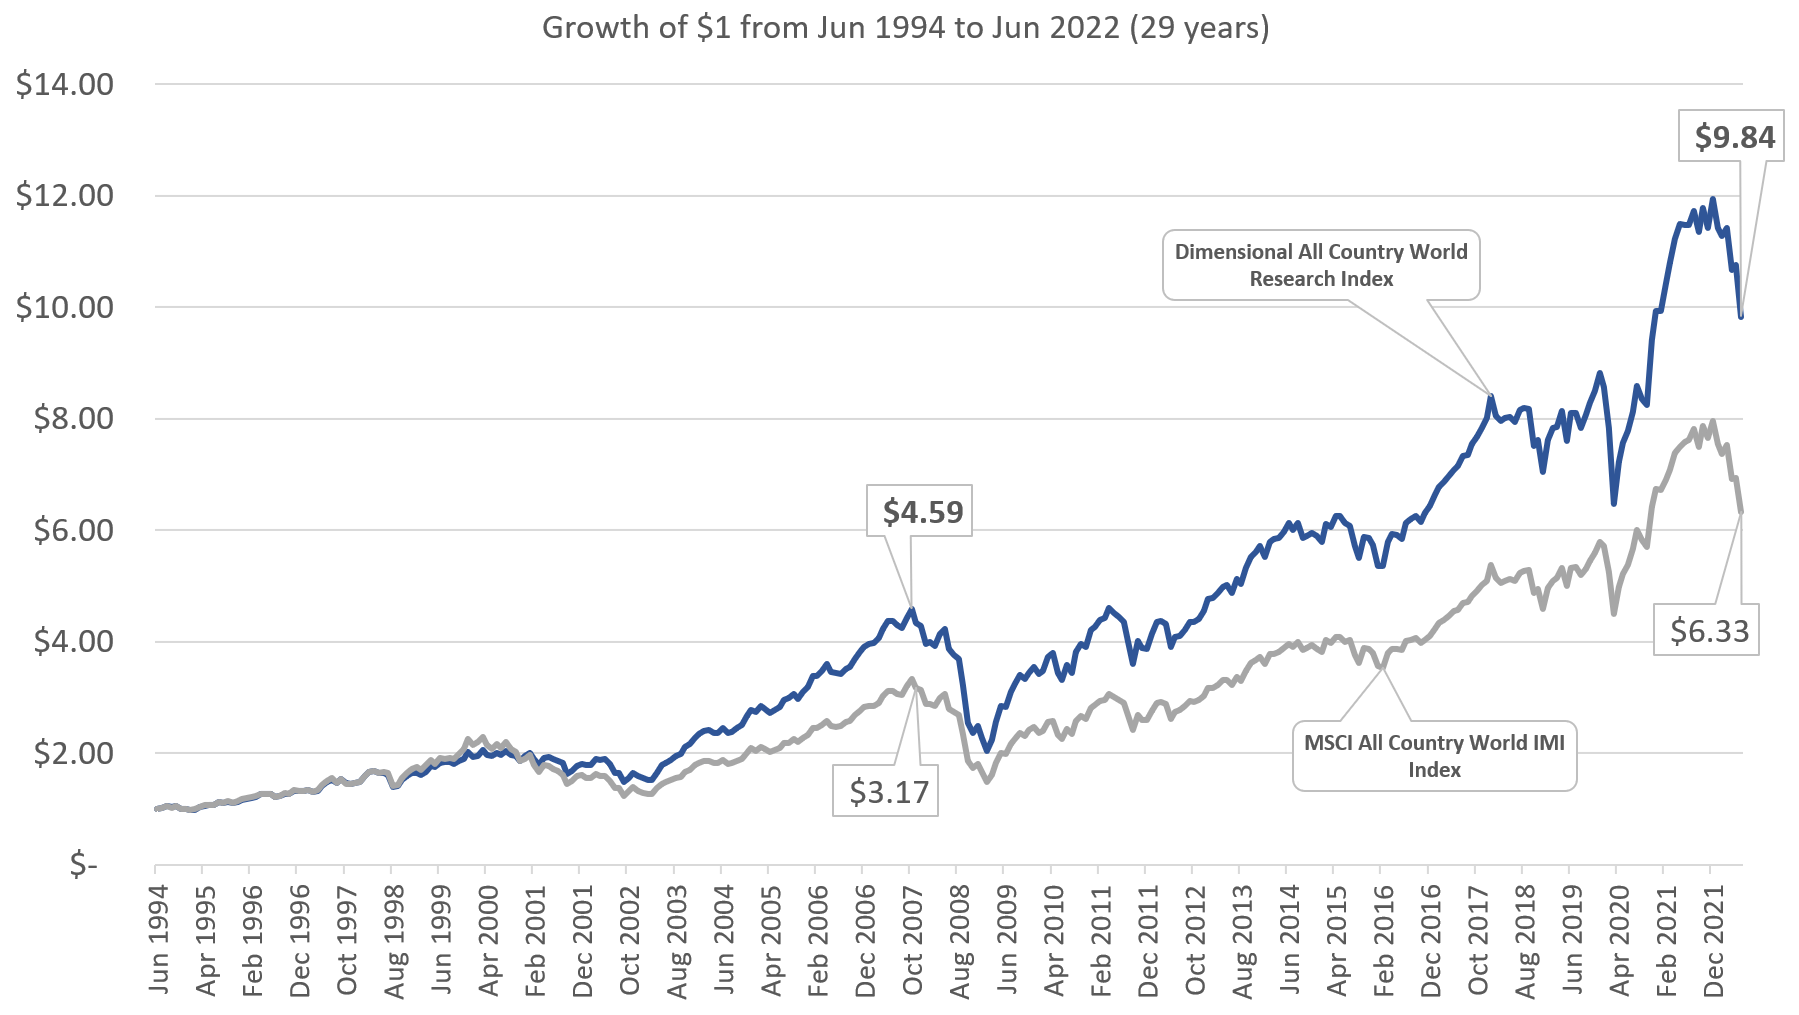
By systematically capturing the risks that, over time, have shown to reward investors, you can earn a potentially more significant return than taking on just market risk. The chart above shows the potential returns you can capture if we systematically tilt the MSCI All Country World portfolio of companies by systematically overweighting the cheaper, smaller and more profitable companies over time.
We will contrast more of the Dimensional all-country and MSCI all-country index performance versus the S&P 500 throughout this article.
Dimensional funds are the core funds we use to construct our high-net-worth client’s portfolios at Providend and also a few Robo-like platforms.
S&P 500 Versus MSCI All Country World 1-Year Returns Review
Let us review the performance of the S&P 500 versus the MSCI All Country World (ACWI). Our limited data spans only 29 years (but vastly more than the data provided by a lot of others) but it allows us to review the performance of the US stock market versus US plus developed markets plus emerging markets over the period.
The first chart compares takes the S&P 500 one-year performance minus that of the MSCI All Country World Index:
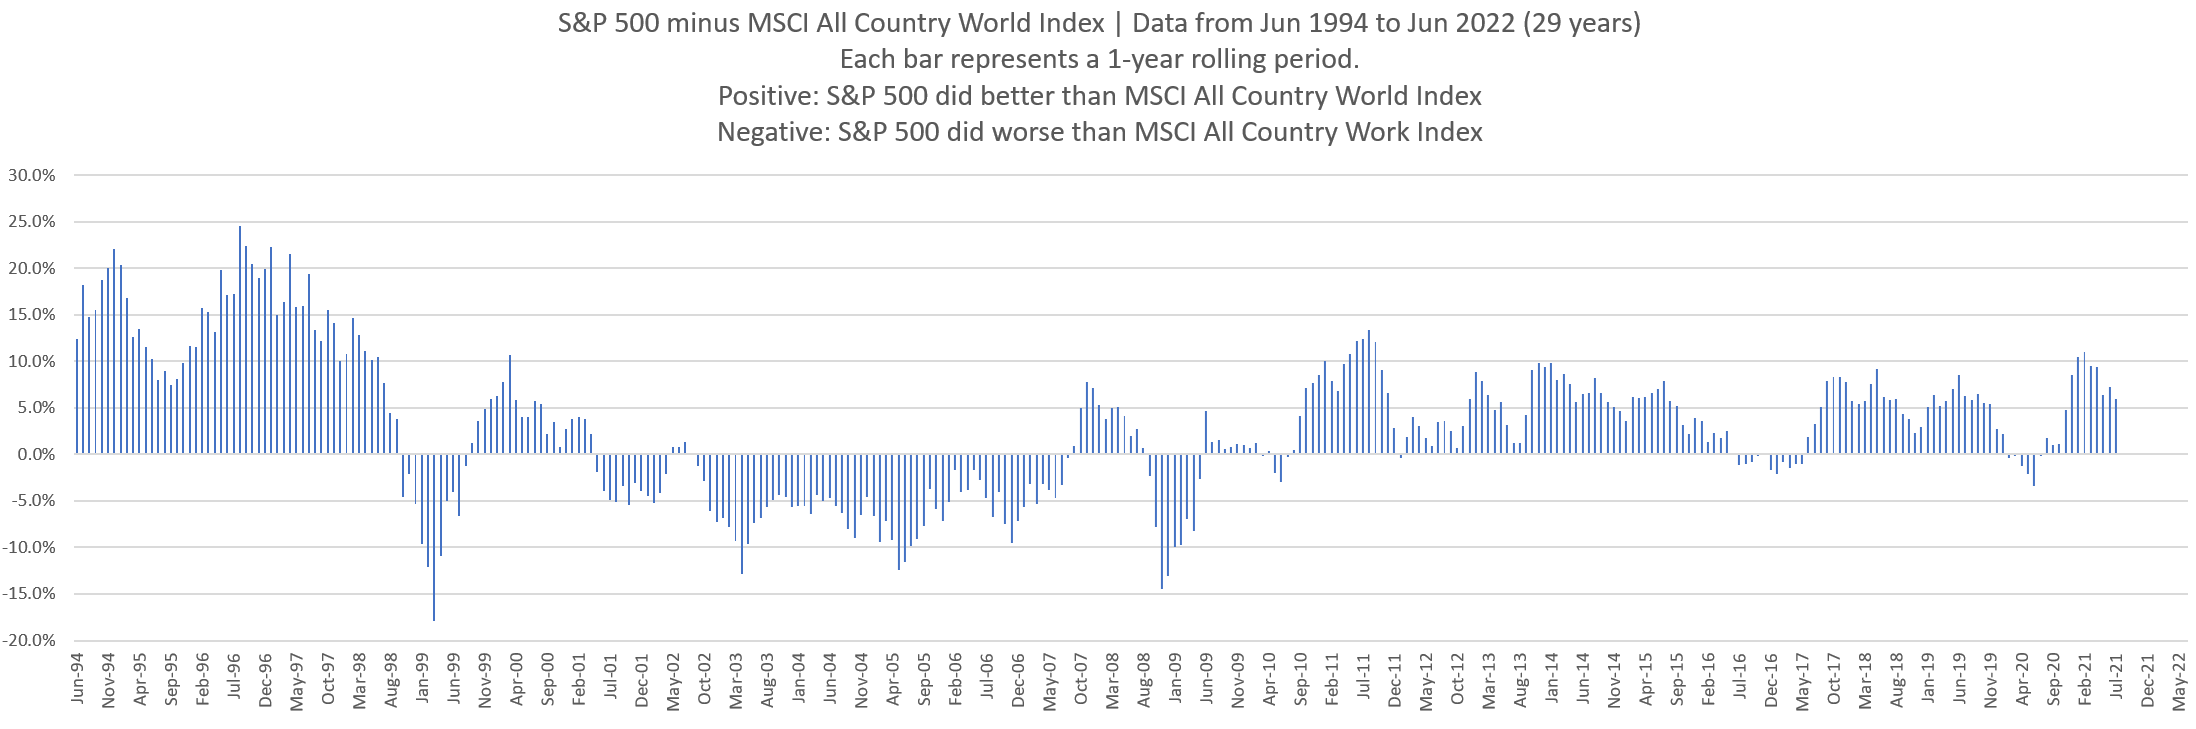
We observe that during the dot com run-up in the mid to late 1990s, the S&P 500 did better. Then the S&P 500 went through a ten-year period where they corrected their very expensive valuations. What also helped was that the emerging market went on a tear from 2002 to 2007.
After the great financial crisis, the US stock market did relatively better again.
You may observe that the outperformance of the S&P 500 is greater during the dot com period, but other than that, the outperformance of the MSCI ACWI is quite similar to the S&P 500.
S&P 500 Versus Dimensional All Country World Research Index 1-Year Returns Review
Now, instead of the MSCI ACWI, let us compare the S&P 500 index to the Dimensional All Country World Research Index. The Dimensional research index is an index Dimensional used to model the returns that is possible if they implement the same strategy before the actual unit trust/ETFs were launched.
By no means are the research indexes the actual portfolio performance, but without these research indexes, how would we have an idea of how well the strategy did historically?
Here is the S&P 500 minus the Dimensional All Country World Research Index:
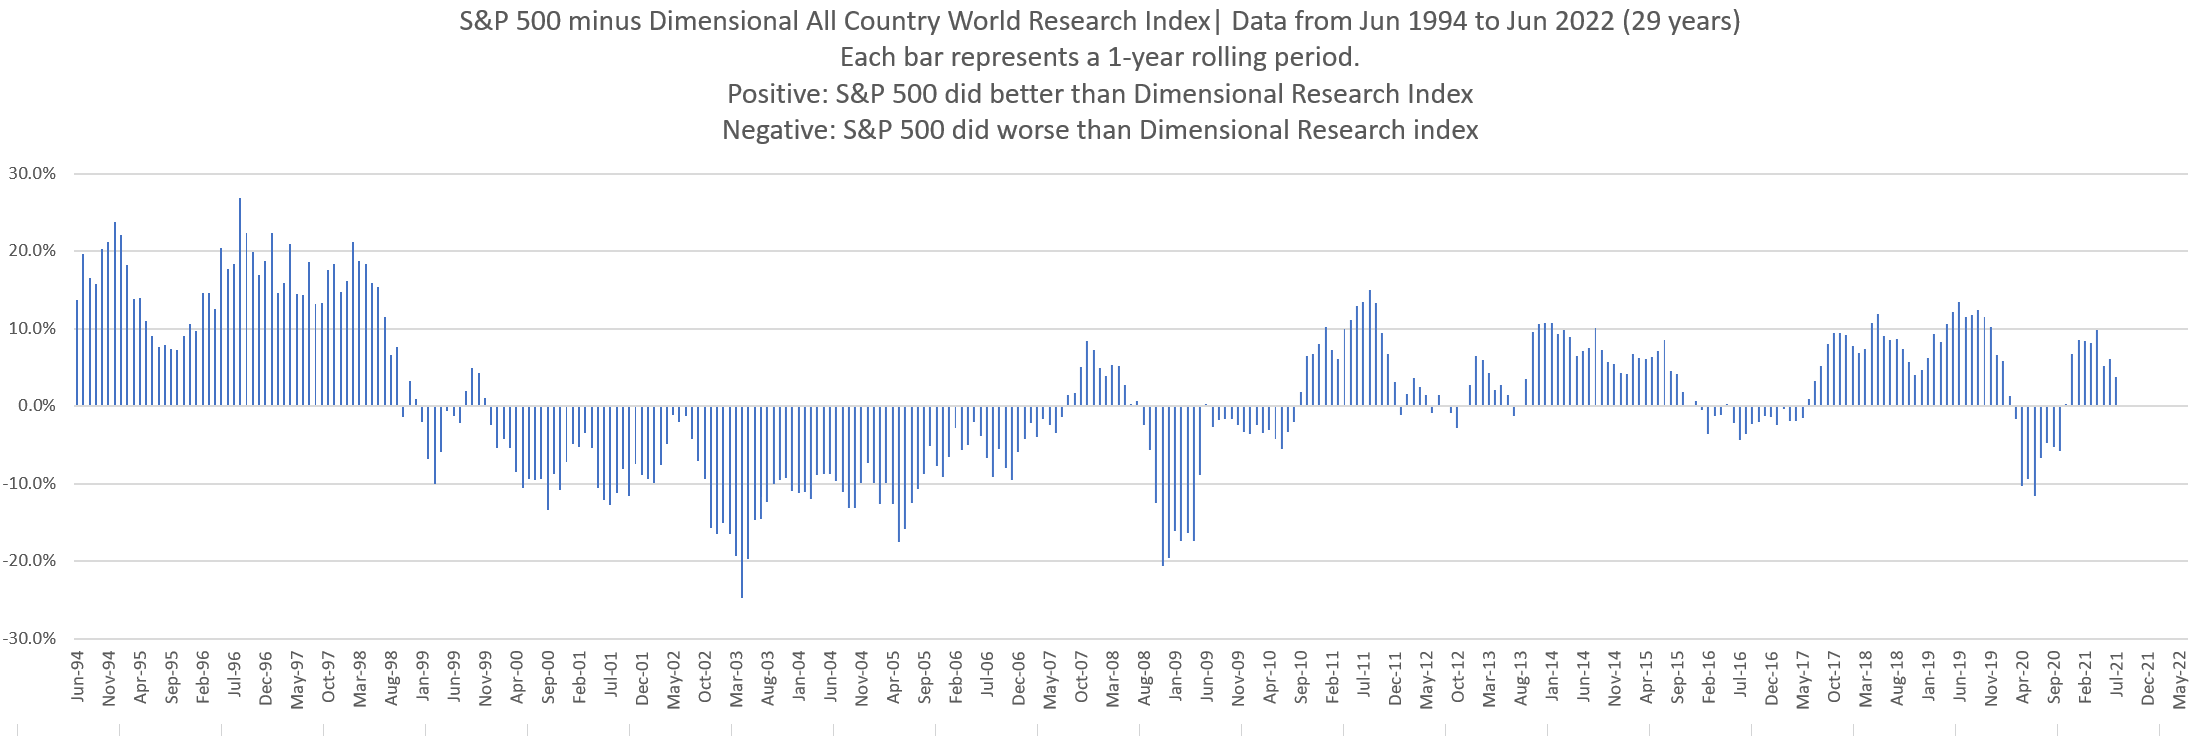
First and foremost, Dimensional is not some magic potion that will wipe off any of ACWI’s underperformance. Notice that when the MSCI ACWI underperformed, the Dimensional research index also did. There are some years of greater or lesser underperformance.
The Dimensional research index provided more outperformance during the years where the MSCI ACWI outperformed the S&P 500.
S&P 500 Versus MSCI All Country World 10-Year Returns Review
Now instead of looking at short-term performance, let us examine the longer-term performance.
The chart below shows the cumulative 10-year performance of the S&P 500 minus MSCI ACWI:
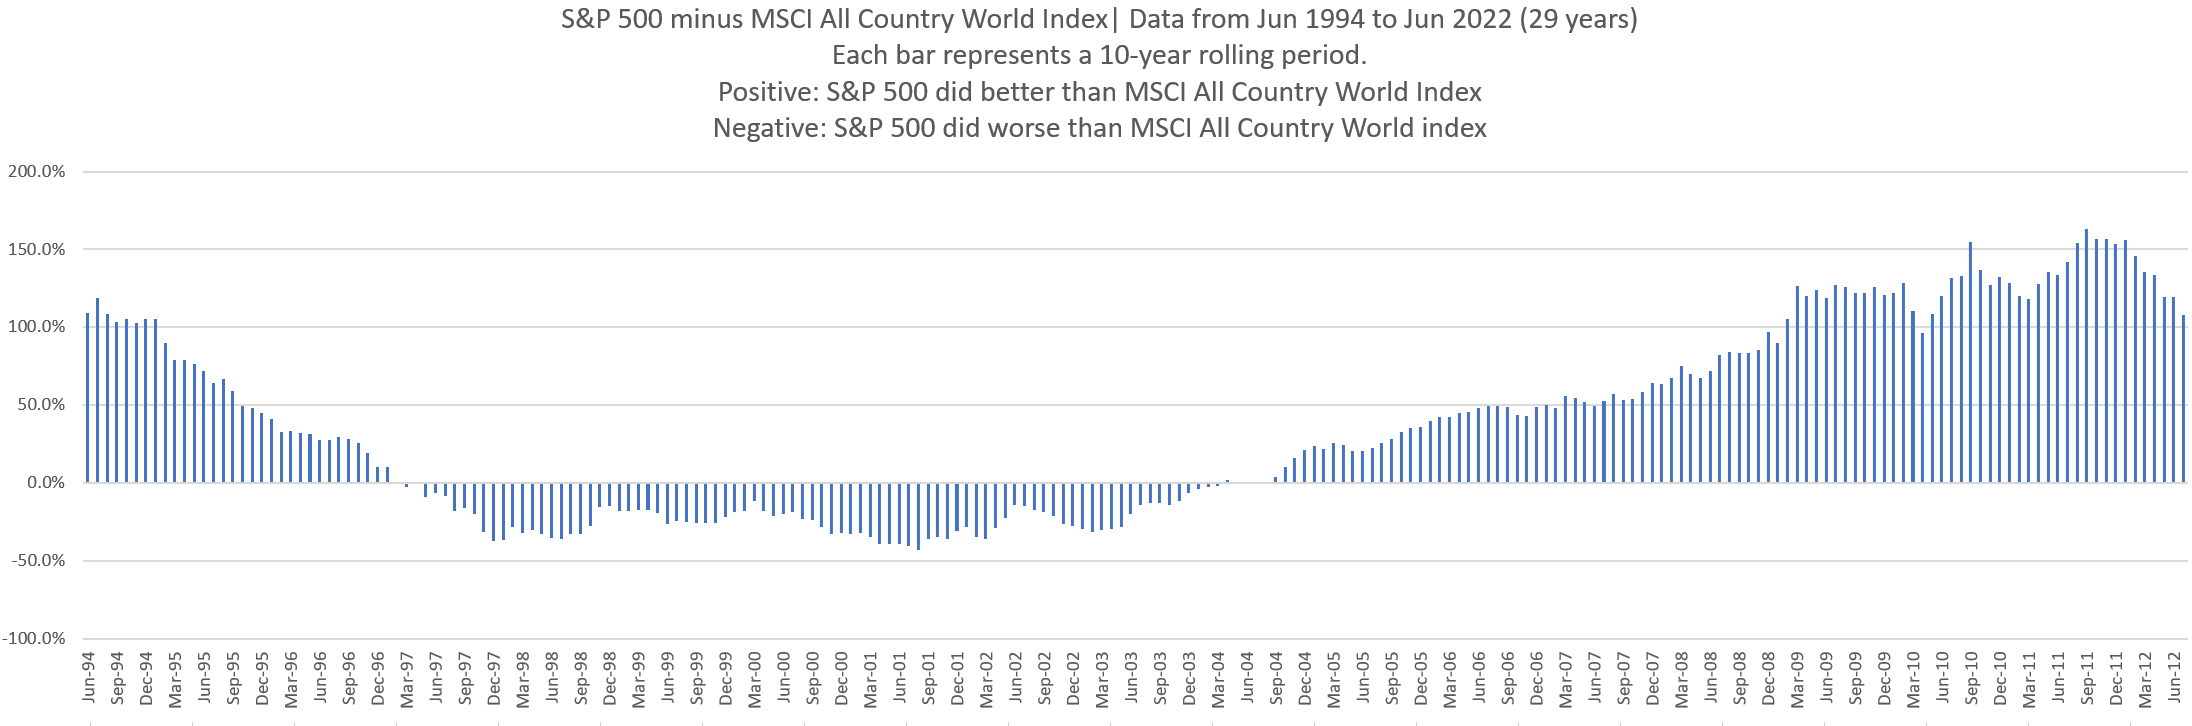
Each bar represents ten years of outperformance or underperformance. If positive, the S&P 500 outperformed over the past ten years and vice versa.
By replacing the MSCI World with the MSCI All Country World, there is little difference. In the ten years that S&P 500 outperformed the MSCI ACWI, the cumulative outperformance was far more significant than the underperformance.
Again, the same question needs to be asked how many people can live through five years of underperformance, let alone ten years, without doing something?
S&P 500 Versus Dimensional All Country World Research Index 10-Year Returns Review
Next, let us compare the ten-year S&P 500 performance versus the ten-year performance of the Dimensional All Country World Research Index:
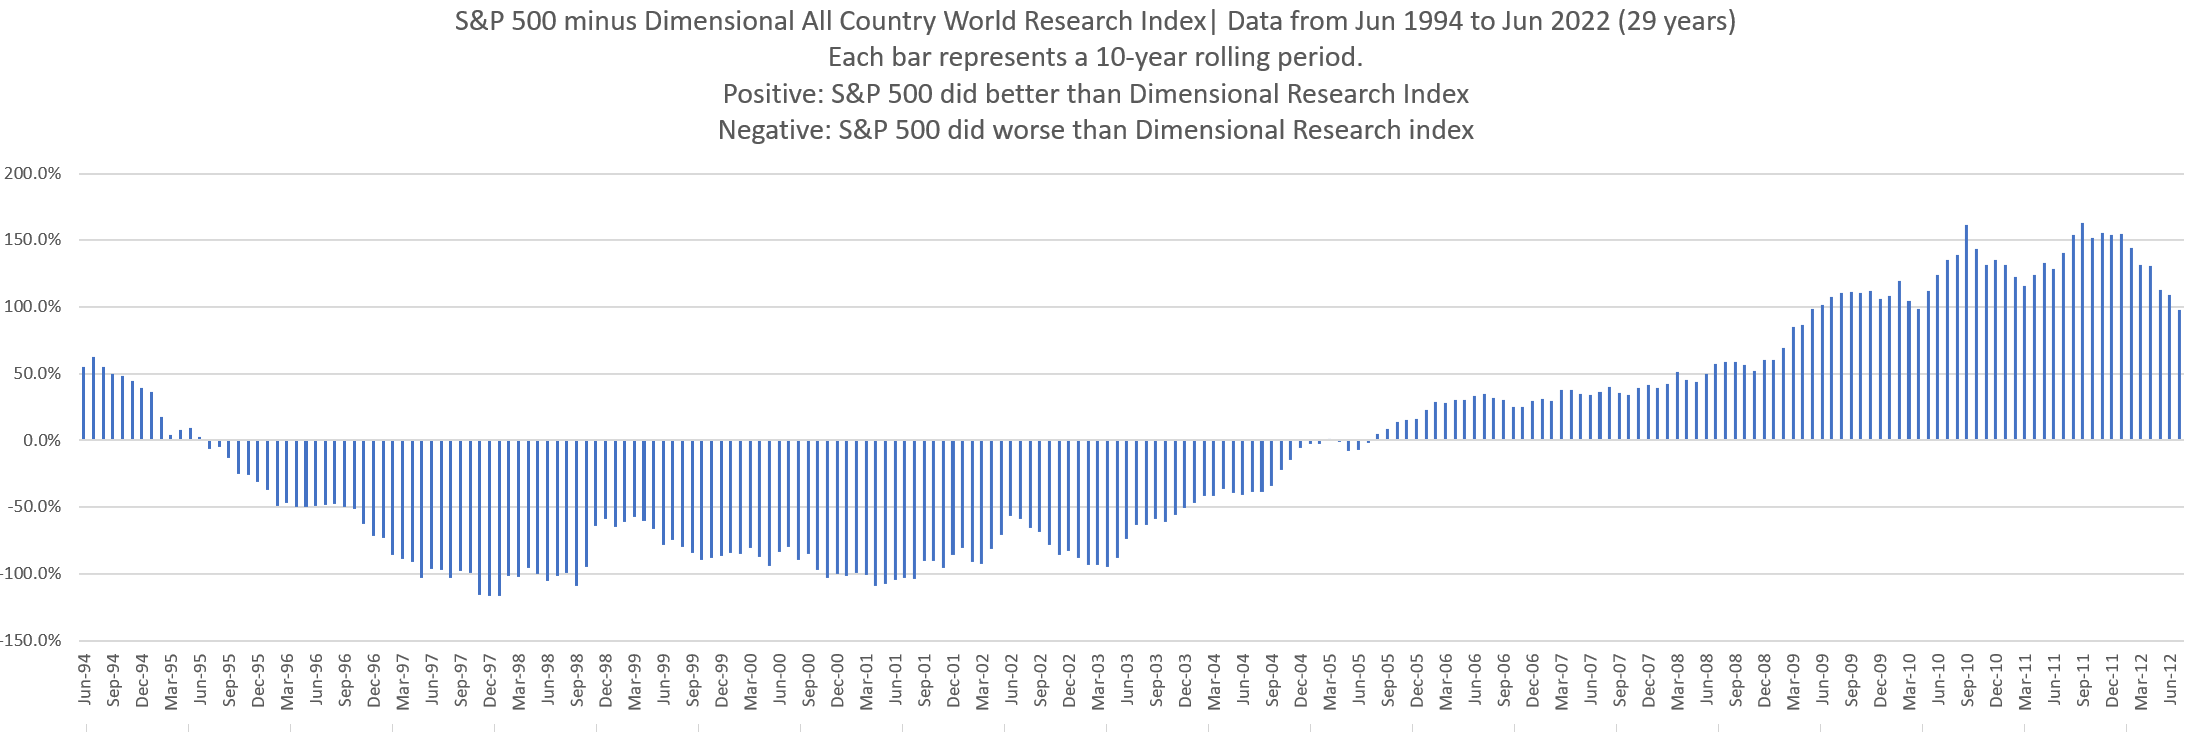
The difference here is the big patch of outperformance by the Dimensional Research Index, far more than the MSCI ACWI over the ten years.
The outperformance started in Mar 1995, when the MSCI ACWI was still underperforming the S&P 500.
S&P 500 significantly underperform the Dimensional research index during the period.
The reason why the Dimensional research index did better than the MSCI ACWI:
- The Dimensional research index tilts or overweights the stocks systematically toward smaller, cheaper and more profitable companies.
- S&P 500 was too overvalued (based on the price-earnings ratio), and cheaper firms did better.
- Smaller companies also did better during that period.
We see the tables turned after 2010, where cheaper and smaller firms did worse versus the general index.
However, in the past decade, the more profitable companies did well.
Dimensional’s multifactor approach allows the different proven factors to smooth out when some factors are not showing up.
The Case for Global & Factor Diversification
The four charts presented in the previous section may frame whether concentrating in the US is down to outperformance, but there will be other considerations.
Here are the cumulative ten-year rolling returns for the S&P 500 from 1994 to today:
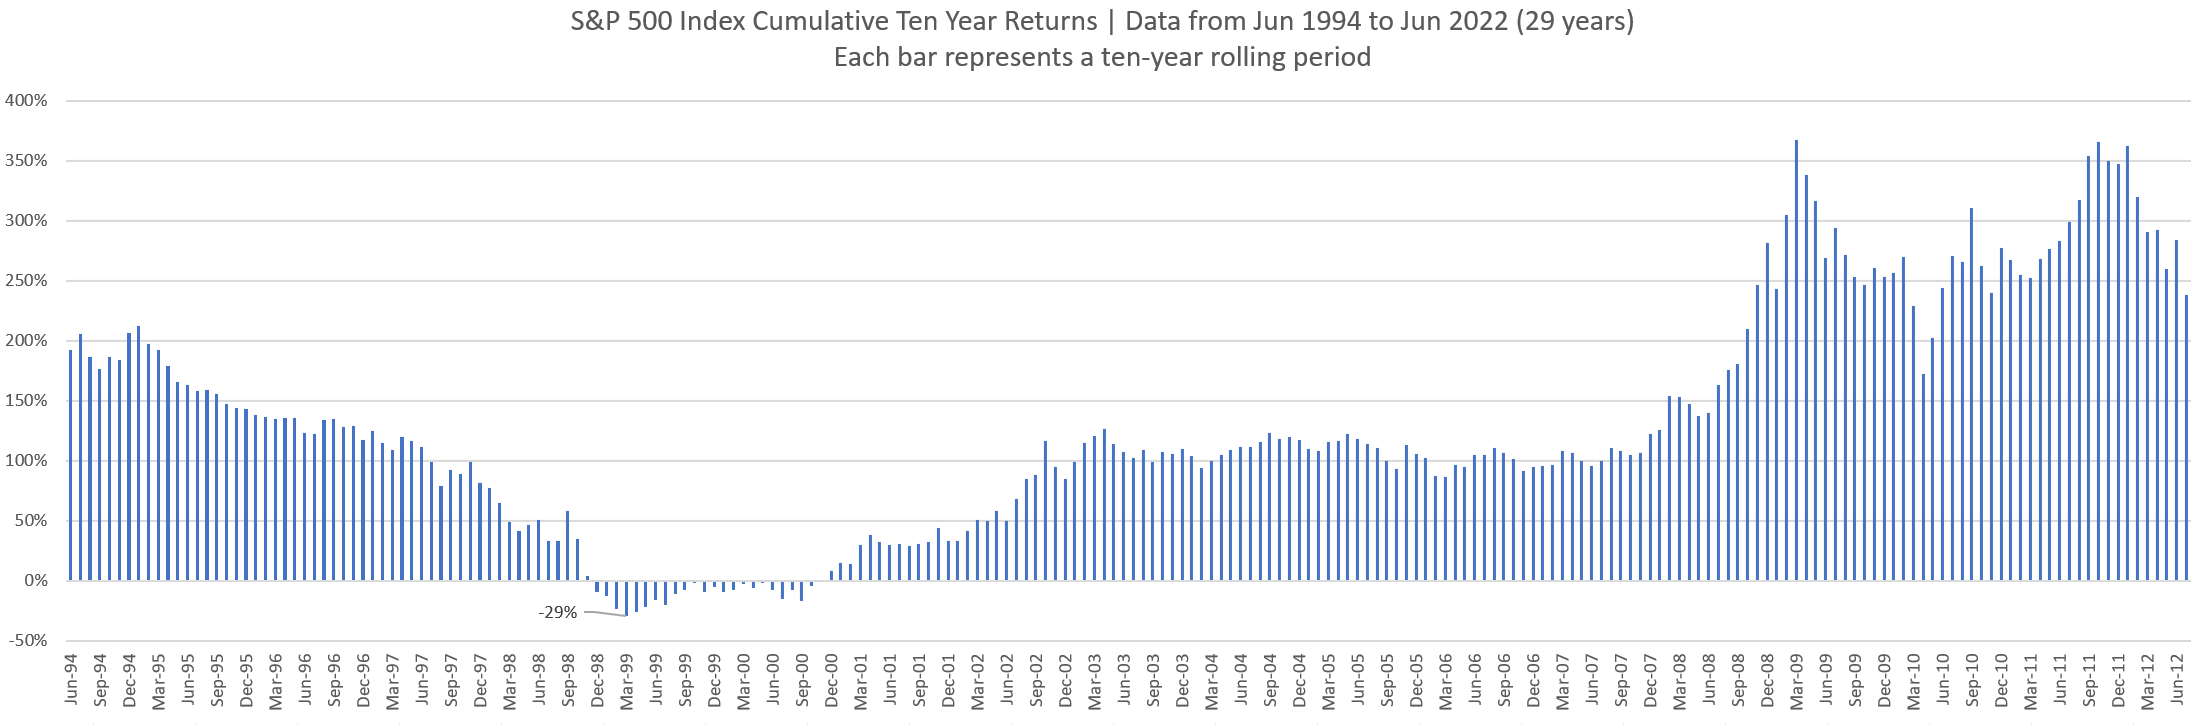
If you invested at any point between 2008 to 2012, $1 would have become $3.50. At most other points, $1 will become $2.
There will be the unlucky ones who would have dumped in all their wealth at peak Mar 1999, and their subsequent ten-year return would be -29%.

If you have invested in an ETF that tracks the MSCI ACWI, your ten-year return in Mar 1999 would be better but still abysmal. To compound that, when the market is doing well, you make less.
End of the day, I concluded that to grow or preserve wealth, you got to live through some financial uncomfortableness.
Investing globally rather than in a dominant country doesn’t guarantee you will avert ten years of negative cumulative returns. Still, it hedges your risk that the dominant country will start fading (which is what a certain Ray Dalio seems to keep drumming about.)
The appeal of investing in a multifactor unit trust or ETF is to capture more risks than just the market risk. More risks may mean higher volatility but potentially be rewarded for taking on that risk through higher returns.
If you invest in different factors that are well empirically tested, then the factors may smooth out your returns.
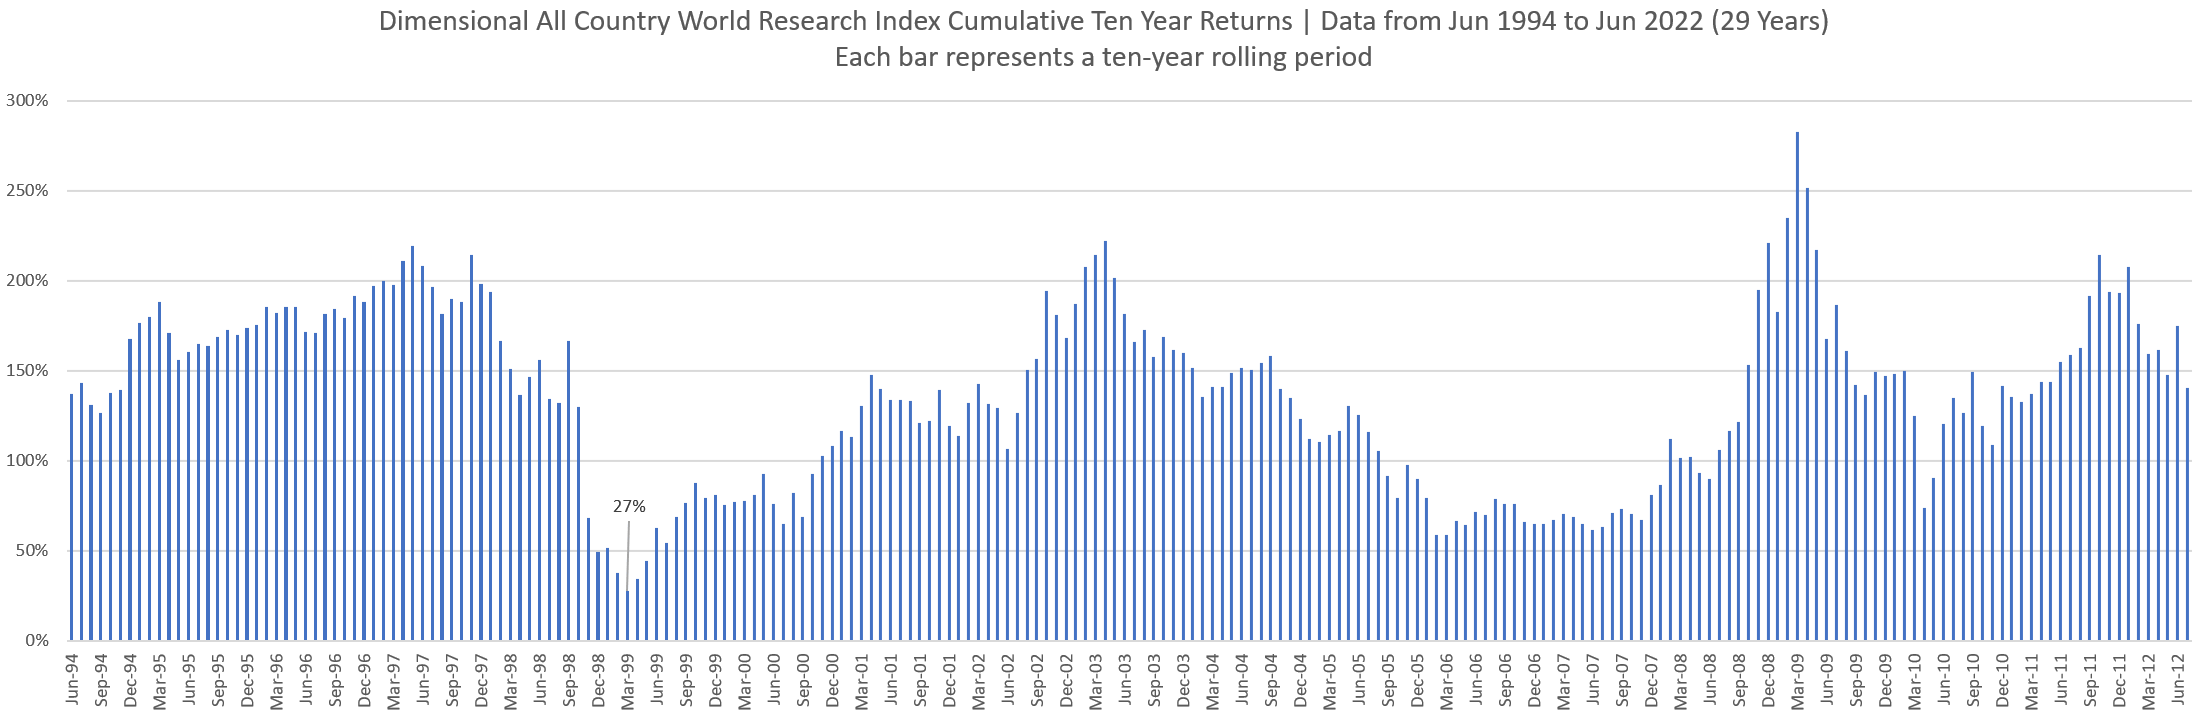
The chart above shows the cumulative ten-year returns of the Dimensional All Country World Research Index. The fund exposes to more risks systematically; therefore, the ten-year cumulative returns are higher than the ACWI.
More importantly, it makes the challenging period of 1999 to 2009 more livable. Psychologically, you may be able to stay invested better.
How You Can Invest in the Indexes Mentioned
I mentioned three indexes, and you can find equivalent ETFs or unit trust to add them to your existing portfolio:
- S&P 500: CSPX, which is a UCITS ETF domiciled in Ireland, is listed on the London Stock Exchange. Another is SPYYou can invest through a broker that lets you trade on the London Stock Exchange. A low-cost, well-established broker is Interactive Brokers.
- MSCI All Country World Index: VWRA, which is a Vanguard UCITS ETF domiciled in Ireland, is listed on the London Stock Exchange. Another UCITS ETF is SSAC, iShare’s implementation. You can invest in VWRA and SSAC through Interactive Brokers as well.
- Dimensional All Country World Research Index: This is just a research index, but if you are interested, you can invest in the Dimensional World Equity Fund, which is a unit trust that implements this multi-factor methodology. You need to invest through an adviser that carries Dimensional funds. The best option is through Endowus. You can invest in a similar all-country world allocation portfolio through MoneyOwl’s equity portfolio.
If you need a referral code to get a $20 to $60 Grab Voucher, you can use my MoneyOwl referral code here.
My Other Data-Driven Index and Multifactor ETF Articles
I do have a few other data-driven Index ETF articles. These are suitable if you are interested in constructing a low-cost, well-diversified, passive portfolio.
You can check them out here:
- IWDA vs VWRA – Are Significant Performance Differences Between the Two Low-Cost ETFs?
- The Beauty of High Yield Bond Funds – What the Data Tells Us
- Searching for Higher Yield in Emerging Market Bonds
- The performance of investing in stocks that can Grow their Dividends for 7/10 years
- Should We Add MSCI World Small-Cap ETF (WSML) to Our Passive Portfolio?
- Review of the LionGlobal Infinity Global – A MSCI World Unit Trust Available for CPF OA Investment
- 222 Years of 60/40 Portfolio Shows Us Balanced Portfolio Corrections are Pretty Mild
- Actively managed funds versus Passive Peers Over the Longer Run – Data
- International Stocks vs the USA before 2010 – Data
- S&P 500 Index vs MSCI World Index Performance Differences Over One and Ten Year Periods – Data
Here are some supplements to sharpen your edge on low-cost, passive ETF investing:
Those who wish to set up their portfolio to capture better returns believe that certain factors such as value, size, quality, momentum and low volatility would do well over time and are willing to harvest these factors through ETFs and funds over time, here are some articles to get you started on factor investing passively:
- Introduction to factor investing / Smart Beta investing.
- IFSW – The iShares MSCI World Multi-factor ETF
- IWMO – The iShares MSCI World Momentum ETF
- GGRA – The WisdomTree Global Quality Dividend Growth UCITS ETF
- Investing in companies with strong economic moats through MOAT and GOAT.
- Robeco’s research into 151 years of Low Volatility Factor – Market returns with lower volatility that did well in different market regimes
- JPGL vs IFSW vs Dimensional Global Core vs SWDA – 22 years of 5-year and 10-year Rolling Returns Performance Comparison
- 98 Years of Data Shows the US Small Cap Value Premium over S&P 500
- 42 Years of data shows that Europe Small Cap Value premium over MSCI Europe
Kyith is the Owner and Sole Writer behind Investment Moats. Readers tune in to Investment Moats to learn and build stronger, firmer wealth foundations, how to have a Passive investment strategy, know more about investing in REITs and the nuts and bolts of Active Investing.
Readers also follow Kyith to learn how to plan well for Financial Security and Financial Independence.
Kyith worked as an IT operations engineer from 2004 to 2019. Currently, he works as a Senior Solutions Specialist in Insurance Start-up Havend. All opinions on Investment Moats are his own and does not represent the views of Providend.
You can view Kyith's current portfolio here, which uses his Free Google Stock Portfolio Tracker.
His investment broker of choice is Interactive Brokers, which allows him to invest in securities from different exchanges all over the world, at very low commission rates, without custodian fees, near spot currency rates.
You can read more about Kyith here.
- My Dividend Experience Investing in UCITS iShares iBond Maturing in 2028. - April 23, 2024
- We Invest into Popular Funds When They Are Popular, Exactly When They Started Turning to Shxt. - April 22, 2024
- Meal Prep 2.0 – Cooking Your “Go-to” Meal that You Look Forward to Eating Everyday. - April 21, 2024