I shared with readers on my Investment Moats Telegram Channel an interesting Stanley Druckenmiller mental model yesterday that I have gotten from Ehren Stanhope of O’Shaughnessy management.
I tend to pen some of my personal thoughts about some of this stuff there and so if you would like to join the channel the link is here.
Ehren was interviewed by the folks at Validea Capital on a recent paper he wrote titled: The Great Inflation, Factors, and Stock Returns.
There is a lot of gems that we can learn more about inflation and the markets, in particular for nerds into factor investing like myself.
Why Inflation in the 1970s is very unique
Inflation is not a very good thing for almost all except class (as you will see the data later).
What worries many of us is whether we will see something similar to the late 1960s to 1970s period.
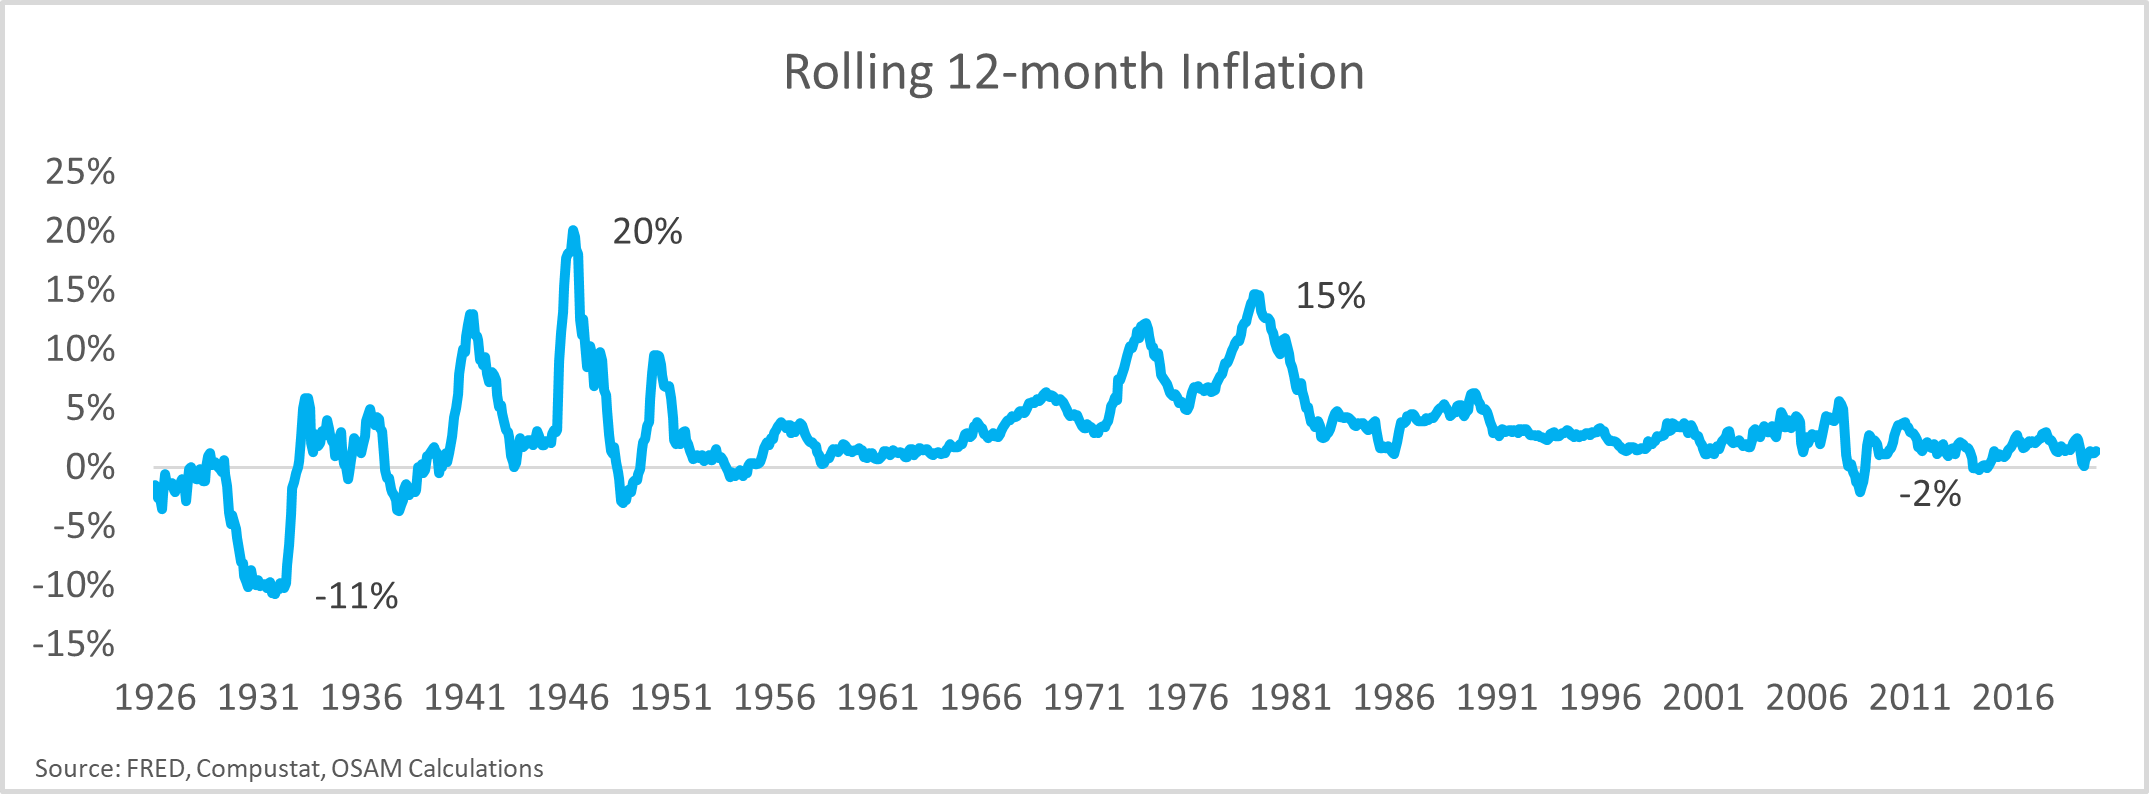
Here is a chart showing the rolling 12-month inflation. There are some pretty crazy inflation in the 1940s and 1970s. In a recent article, I bring to your attention why Fidelity’s Jurrien Timmer thinks 1940s-style inflation is more similar to our current environment than other periods.
Between 1965 to 1982, inflation annualized at 6.5%.
Ehren feels that what went on during this period is rather unique in that it may cause what happened in the 1970s very special.
1. Personal and corporate tax rates were much higher than today’s highest expectations. The employment act of 1946 encourages the government to aim for maximum employment. Government policies target full employment and ignore price pressures. Personal tax rates were high with the average individual marginal tax rate close to 57%. Corporate tax rate averages 48%.
High tax rates within high inflation regimes can push the effective tax rate well above 100%! In such an extreme situation, it behoves corporations to rack up expenses to reduce pre-tax profits.
2. While our money supply today grow at a similar rate as the 1970s great inflation period, the velocity of money has remained sluggish, mitigating the risk of an inflationary spike. Heavily influenced by the Phillips Curve, central bankers are more tolerant of higher inflation as this benefits higher employment.
3. Organized labour as union membership grew rapidly after the Great Depression due to New Deal legislation. Strong collective bargaining and rising wages fueled economic growth and inflation. There is a flywheel that can perpetuate the growth of wages and inflation, notably at full employment. Rising wages fuel demand for products and services, which pushes up prices, which pushes up labour’s demand for wage increases, etc. This has fallen quite a lot today.
4. 1973 featured a major oil shock due to an oil embargo proclaimed by Saudi Arabia. The US was importing 17% of total energy consumption. Today, the US is a net exporter instead of an importer of energy.
These four ingredients may have served up the perfect recipe for inflation.
I still have my doubts. These factors especially employment decisions seem awfully localised. It requires further investigation into whether other countries were also practising similar policies. We know they also experience high inflation during the period.
Now let us take a look at some equity data.
How did equities and different factors do in different inflation regimes?
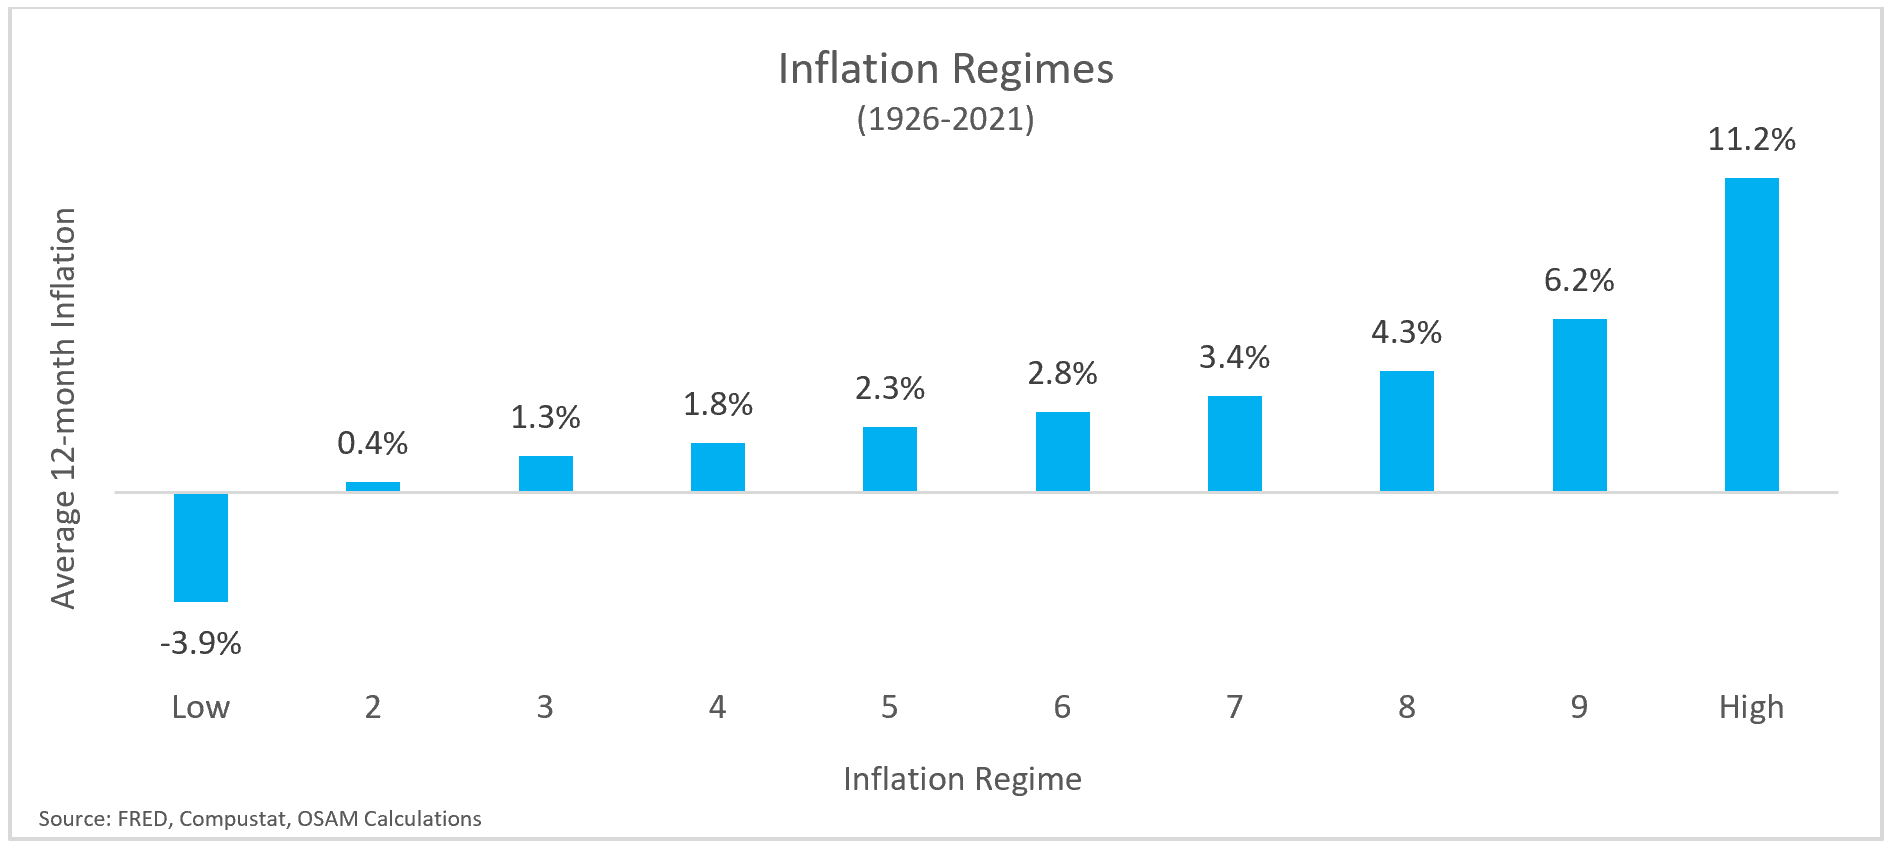
Ehren’s team first calculate the rolling 12-month rate of inflation as of each month between Jan 1926 to Jun 2021 (very recent). They then divide the observations into 10 different buckets based on the level of inflation.
The average inflation hovers around 2.3% to 2.8%.
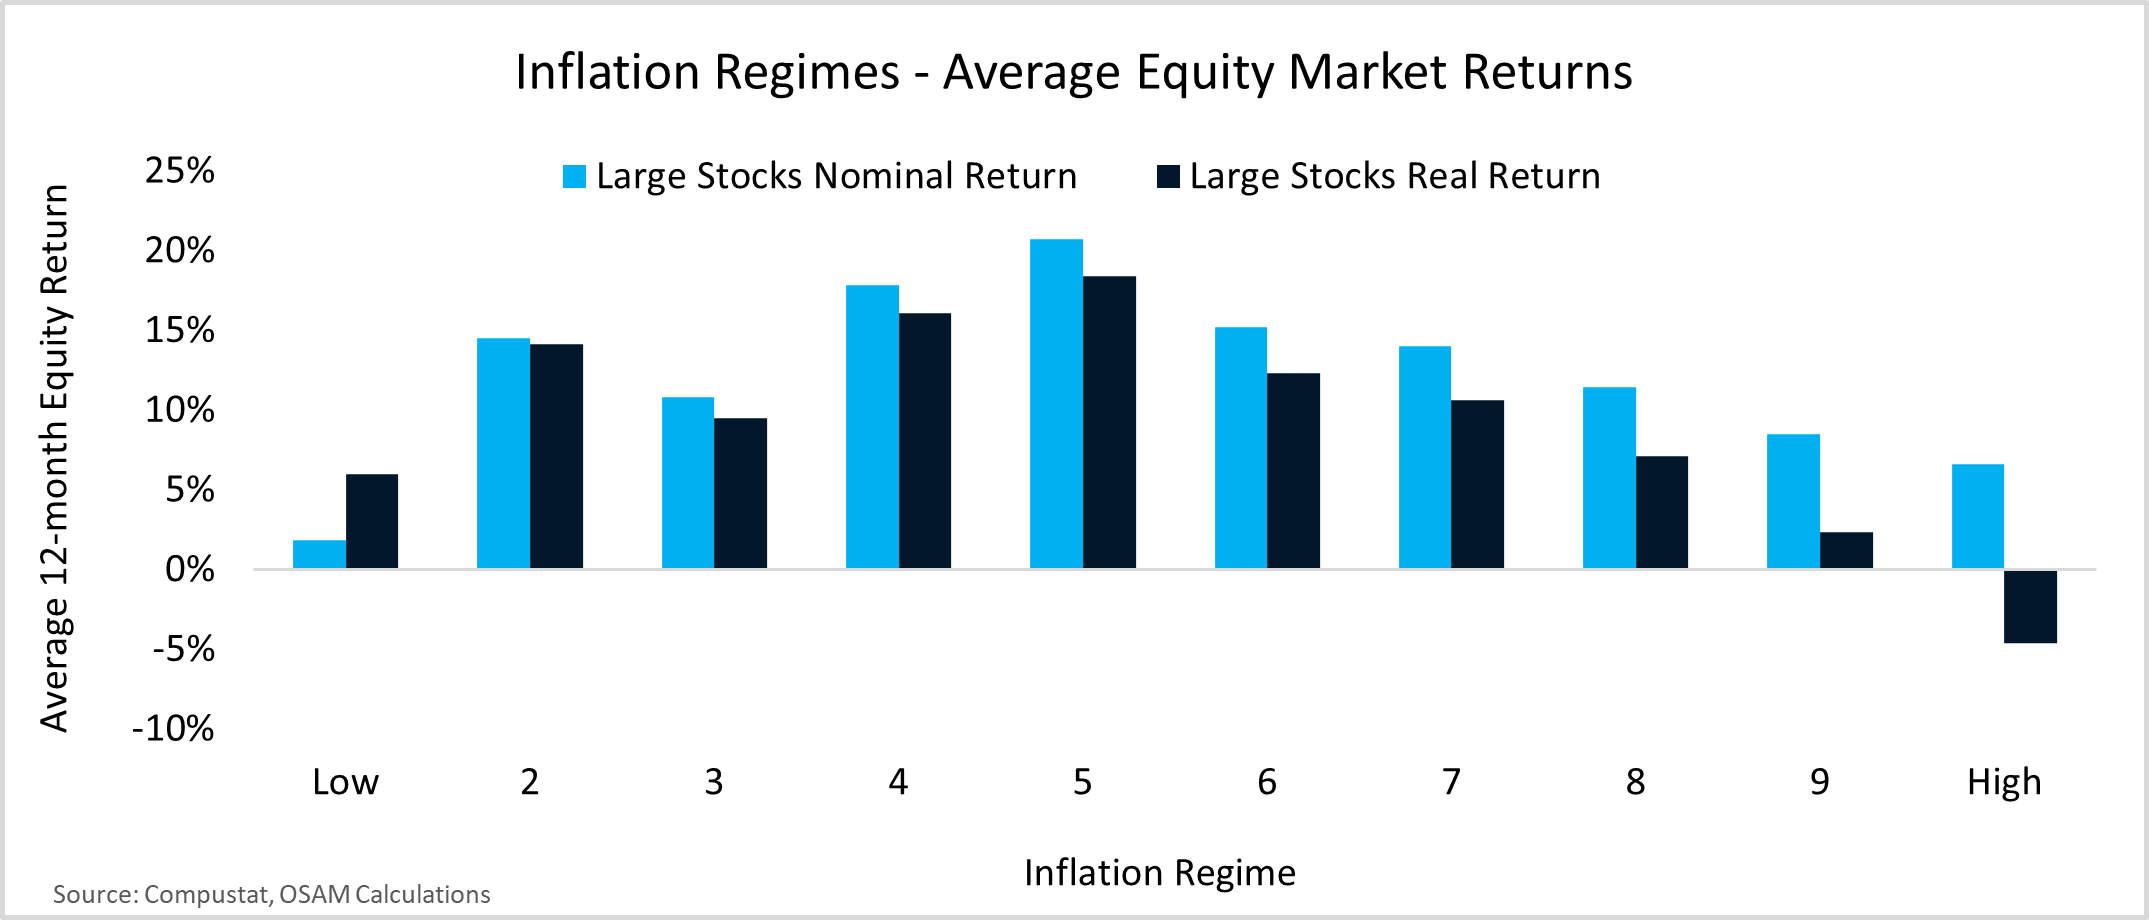
This chart basically shows the nominal and real return of large-cap stocks during each inflation regime.
On a nominal basis, large-cap stocks are positive during different inflation regimes. But if we account for inflation (dark blue bar), even stocks cannot maintain their purchasing power during the regimes with the highest inflation (11.2% inflation).
The challenging thing about inflation is that, while we are experiencing it, we won’t know if this is a period of high inflation or this is just an inflation spike.
Most often, we will only know during hindsight.

The team also take a look at how three different equity factors do during different inflation regimes.
The value and momentum factors are some of the most popular factors out there. They have been shown to exist over 200 years in different markets.
Shareholder yield, which comprises dividends and share buybacks can be viewed as a factor closer to value.
This chart shows the excess return which according to my interpretation would be an additional return over what you get for taking on market risk by investing in stocks.
The value factor did very well when inflation is higher. The value factor does not do as well during deflation regimes. During high inflation periods, PE multiples tend to be suppressed. For value stocks, their PE is already low, thus the impact of PE compression is reduced.
Shareholder yield does well in almost all periods except for the 2nd decile.
The momentum factor is surprising to me. Momentum is not a growth stock. As we see recently, the momentum indexes are made up of value finance stocks because they have shown strong momentum in the past six to twelve months.
Ehren’s team wrote that price momentum tends to be pretty good at identifying earnings growth in advance.
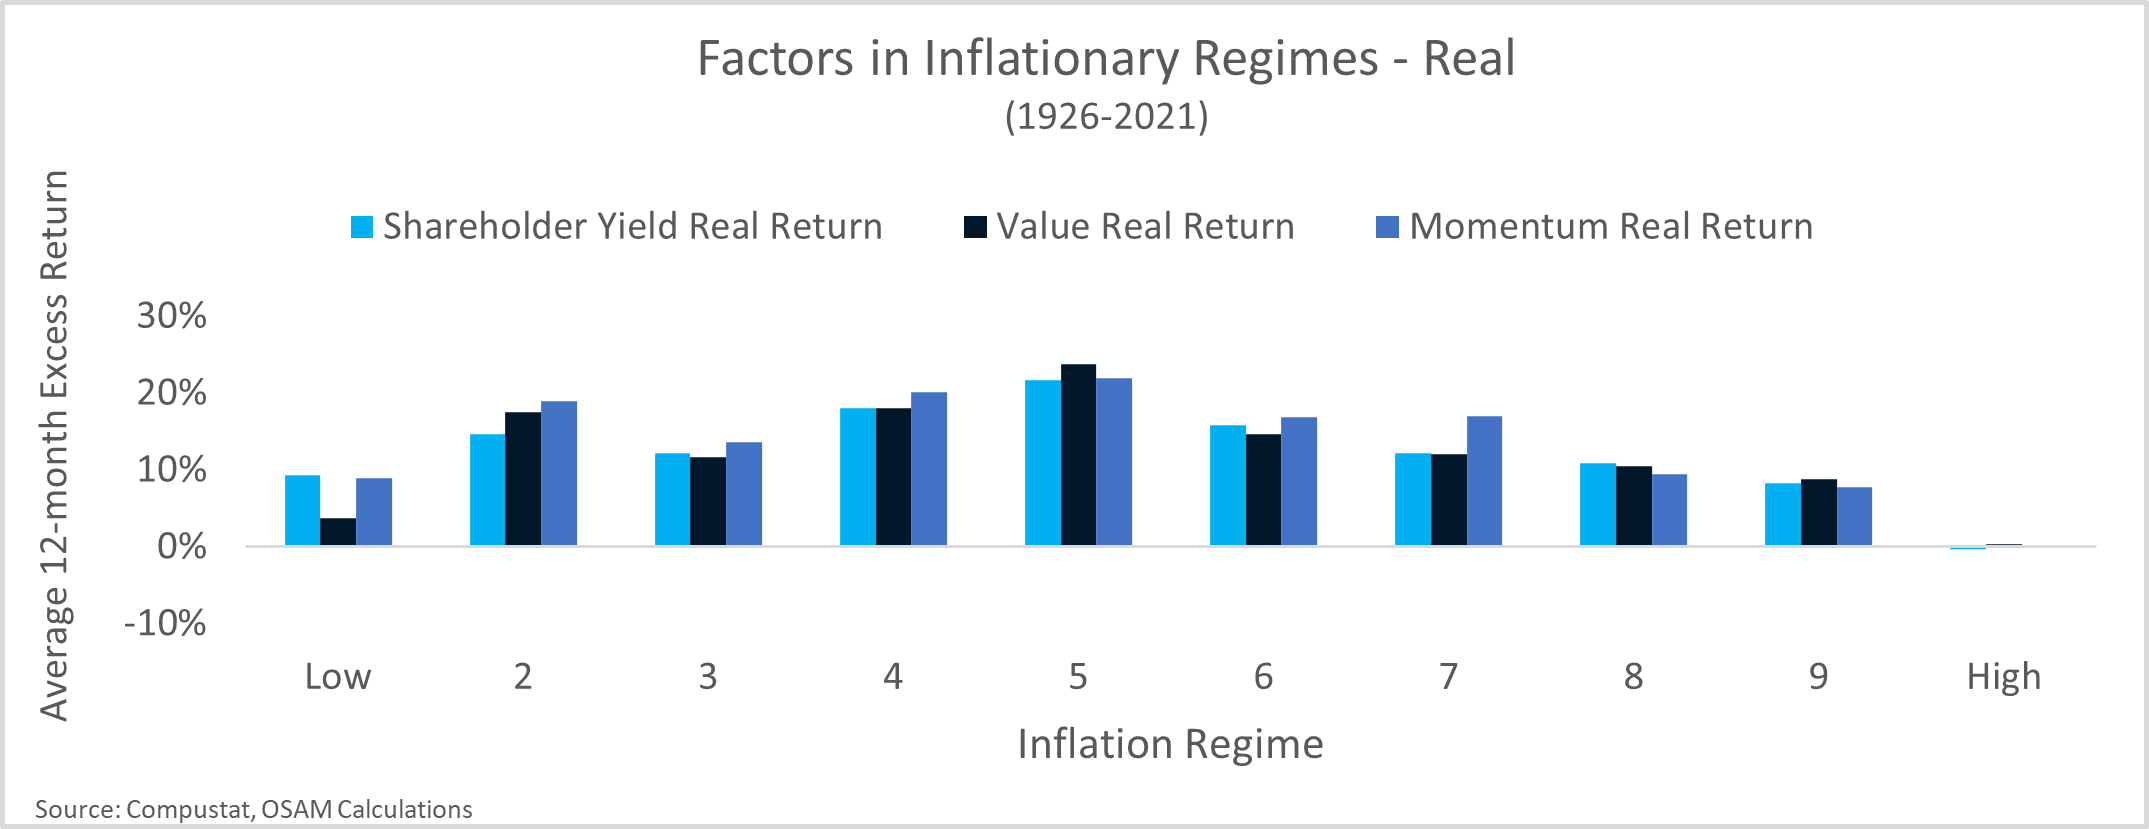
If we factor in inflation, you will realize that in the highest decile the excess return is near 0%. The excess return associated with the factors allows equity investors to just keep pace with purchasing power.
This is in contrast to negative real returns if you just buy a basket of large-cap stocks.
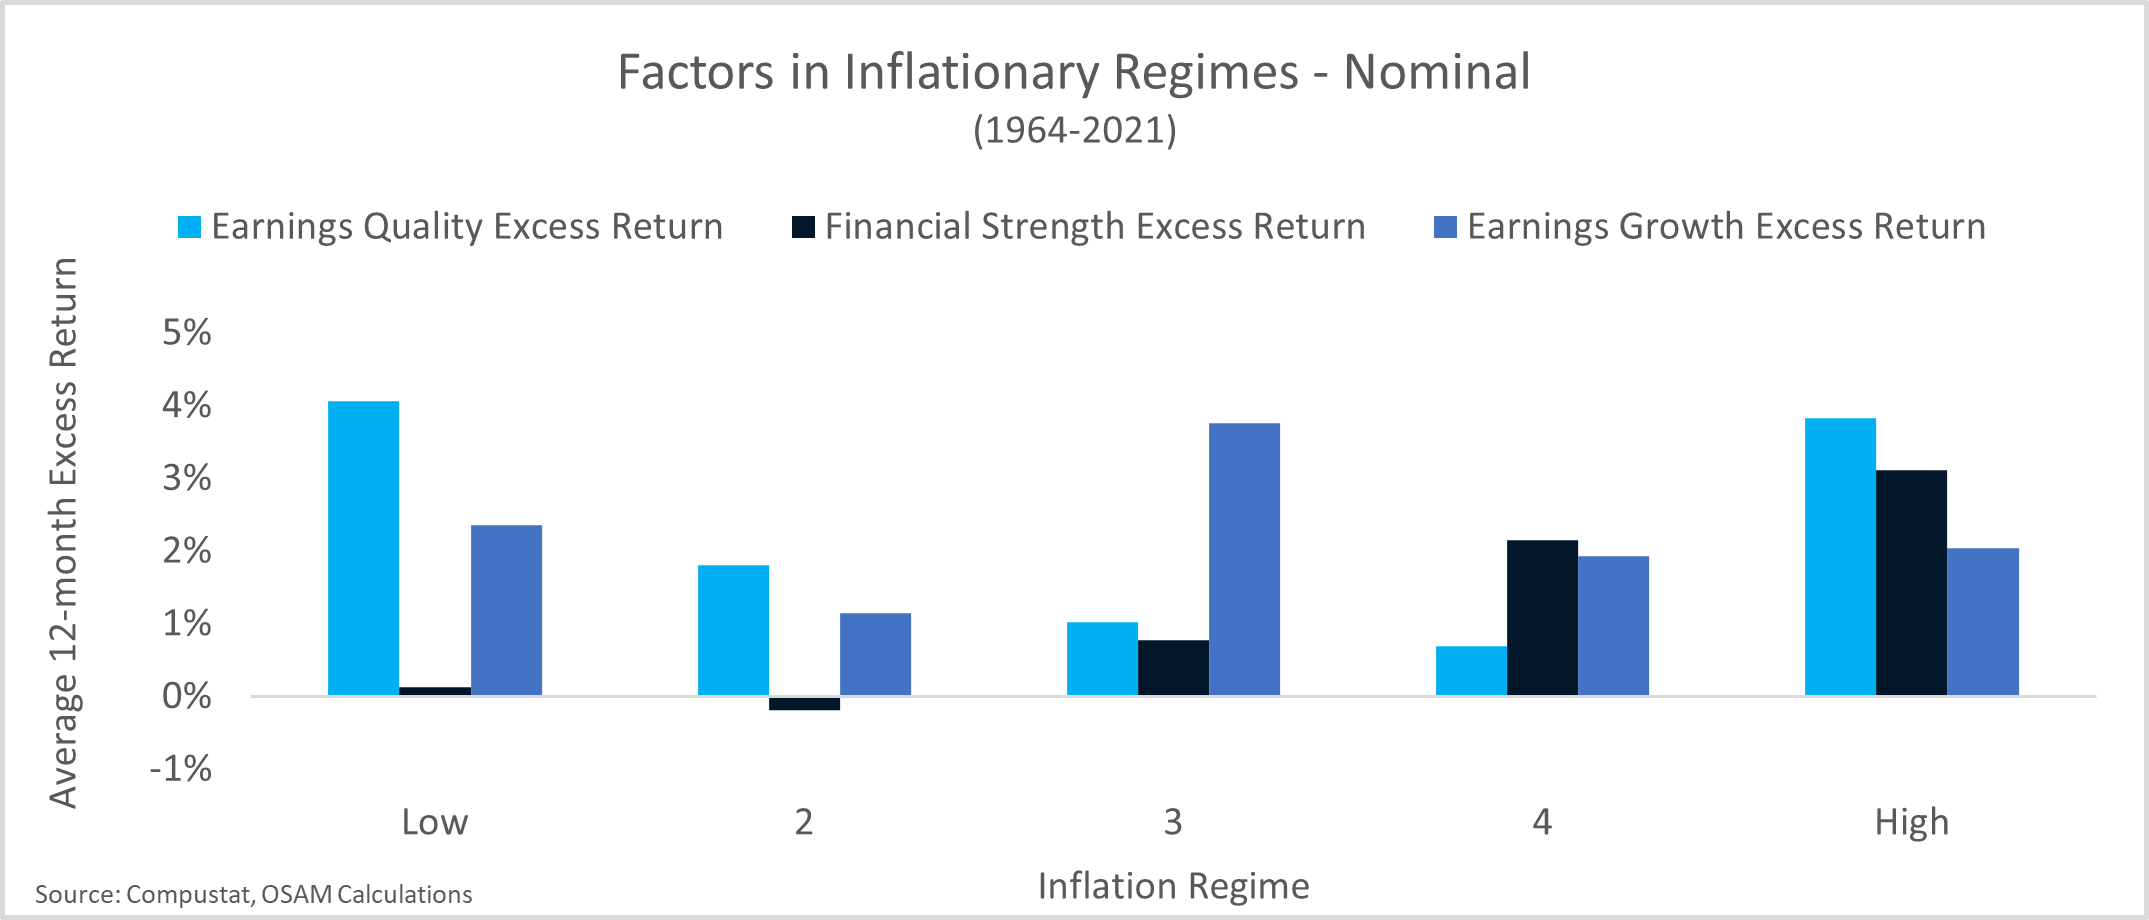
The team also took a look at how different quality factors did in different inflation regimes. Instead of 10 deciles, this one is subdivided into 5 buckets and the data is only from 1964 to 2021.
Earnings quality evaluates conservative accounting choices and capital allocation. It tends to perform well in both low and high inflation regimes but we cannot tell how greatly affected this factor is by higher or lower inflation.
Financial strength measures the reliance on outside sources of capital to support the balance sheet. They tend to do better when inflation is higher while the excess returns disappear during low inflation periods.
Earnings growth evaluates the health of the underlying business through margins, free cash flow trends and returns on capital. We cannot tell how inflation affects this quality factor as the excess returns do not show a certain trend as inflation is higher or lower.

Again, during periods of high inflation the excess returns disappear.
Some Reflections
I think as a whole, inflation is quite challenging to navigate but it seems like the conditions to get extremely high inflation may not all exist currently. We can observe in the future whether these exist.
ESG may create a situation where there is a constrain to supply enough energy for our needs. This might impact inflation. But that is just one factor out of four.
There are a couple of takeaways from O’Shaughenessy’s factor research:
- Equities hedge inflation risk well but perhaps not when inflation is at the most extreme.
- There are excess returns, above the returns that we can get by taking a market risk by investing in equities, through different factors such as value, momentum, different quality specifications. And this might allow us to preserve our purchasing power.
I do have a few other data-driven Index ETF articles. These are suitable if you are interested in constructing a low-cost, well-diversified, passive portfolio.
You can check them out here:
- IWDA vs VWRA – Are Significant Performance Differences Between the Two Low-Cost ETFs?
- The Beauty of High Yield Bond Funds – What the Data Tells Us
- Searching for Higher Yield in Emerging Market Bonds
- The performance of investing in stocks that can Grow their Dividends for 7/10 years
- Should We Add MSCI World Small-Cap ETF (WSML) to Our Passive Portfolio?
- Review of the LionGlobal Infinity Global – A MSCI World Unit Trust Available for CPF OA Investment
- 222 Years of 60/40 Portfolio Shows Us Balanced Portfolio Corrections are Pretty Mild
- Actively managed funds versus Passive Peers Over the Longer Run – Data
- International Stocks vs the USA before 2010 – Data
- S&P 500 Index vs MSCI World Index Performance Differences Over One and Ten Year Periods – Data
Here are some supplements to sharpen your edge on low-cost, passive ETF investing:
Those who wish to set up their portfolio to capture better returns believe that certain factors such as value, size, quality, momentum and low volatility would do well over time and are willing to harvest these factors through ETFs and funds over time, here are some articles to get you started on factor investing passively:
- Introduction to factor investing / Smart Beta investing.
- IFSW – The iShares MSCI World Multi-factor ETF
- IWMO – The iShares MSCI World Momentum ETF
- GGRA – The WisdomTree Global Quality Dividend Growth UCITS ETF
- Investing in companies with strong economic moats through MOAT and GOAT.
- Robeco’s research into 151 years of Low Volatility Factor – Market returns with lower volatility that did well in different market regimes
- JPGL vs IFSW vs Dimensional Global Core vs SWDA – 22 years of 5-year and 10-year Rolling Returns Performance Comparison
- 98 Years of Data Shows the US Small Cap Value Premium over S&P 500
- 42 Years of data shows that Europe Small Cap Value premium over MSCI Europe
I invested in a diversified portfolio of exchange-traded funds (ETF) and stocks listed in the US, Hong Kong and London.
My preferred broker to trade and custodize my investments is Interactive Brokers. Interactive Brokers allow you to trade in the US, UK, Europe, Singapore, Hong Kong and many other markets. Options as well. There are no minimum monthly charges, very low forex fees for currency exchange, very low commissions for various markets.
To find out more visit Interactive Brokers today.
Join the Investment Moats Telegram channel here. I will share the materials, research, investment data, deals that I come across that enable me to run Investment Moats.


Do Like Me on Facebook. I share some tidbits that are not on the blog post there often. You can also choose to subscribe to my content via the email below.
I break down my resources according to these topics:
- Building Your Wealth Foundation – If you know and apply these simple financial concepts, your long term wealth should be pretty well managed. Find out what they are
- Active Investing – For active stock investors. My deeper thoughts from my stock investing experience
- Learning about REITs – My Free “Course” on REIT Investing for Beginners and Seasoned Investors
- Dividend Stock Tracker – Track all the common 4-10% yielding dividend stocks in SG
- Free Stock Portfolio Tracking Google Sheets that many love
- Retirement Planning, Financial Independence and Spending down money – My deep dive into how much you need to achieve these, and the different ways you can be financially free
- Providend – Where I used to work doing research. Fee-Only Advisory. No Commissions. Financial Independence Advisers and Retirement Specialists. No charge for the first meeting to understand how it works
- Havend – Where I currently work. We wish to deliver commission-based insurance advice in a better way.
Kyith is the Owner and Sole Writer behind Investment Moats. Readers tune in to Investment Moats to learn and build stronger, firmer wealth foundations, how to have a Passive investment strategy, know more about investing in REITs and the nuts and bolts of Active Investing.
Readers also follow Kyith to learn how to plan well for Financial Security and Financial Independence.
Kyith worked as an IT operations engineer from 2004 to 2019. Currently, he works as a Senior Solutions Specialist in Insurance Start-up Havend. All opinions on Investment Moats are his own and does not represent the views of Providend.
You can view Kyith's current portfolio here, which uses his Free Google Stock Portfolio Tracker.
His investment broker of choice is Interactive Brokers, which allows him to invest in securities from different exchanges all over the world, at very low commission rates, without custodian fees, near spot currency rates.
You can read more about Kyith here.
- New 6-Month Singapore T-Bill Yield in Late-April 2024 to Drop to 3.70% (for the Singaporean Savers) - April 18, 2024
- Golden Nuggets from JPMorgan Guide to Retirement 2024. - April 16, 2024
- Be Less Reliant on Banks and Build Stronger Capital Markets by Pushing for Better Shareholder Dividend and Buyback Yield - April 14, 2024