
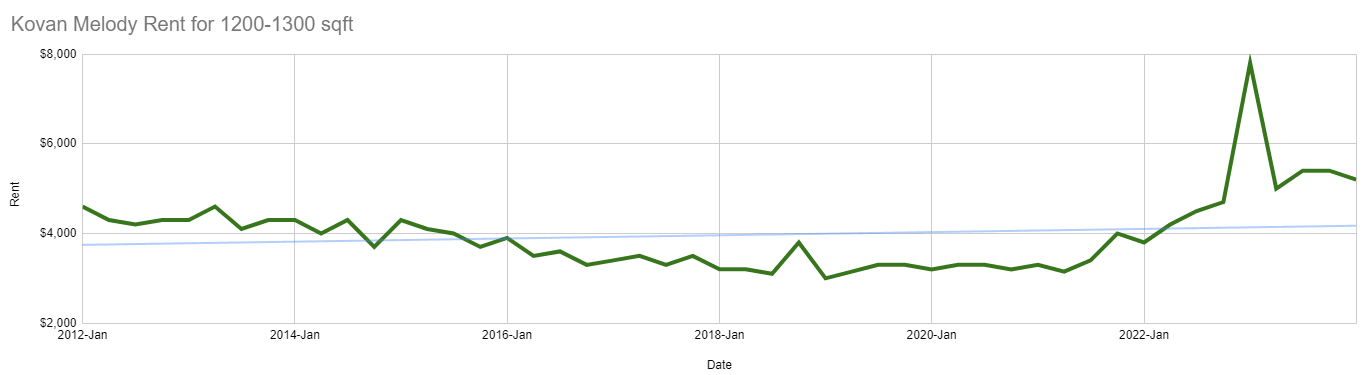
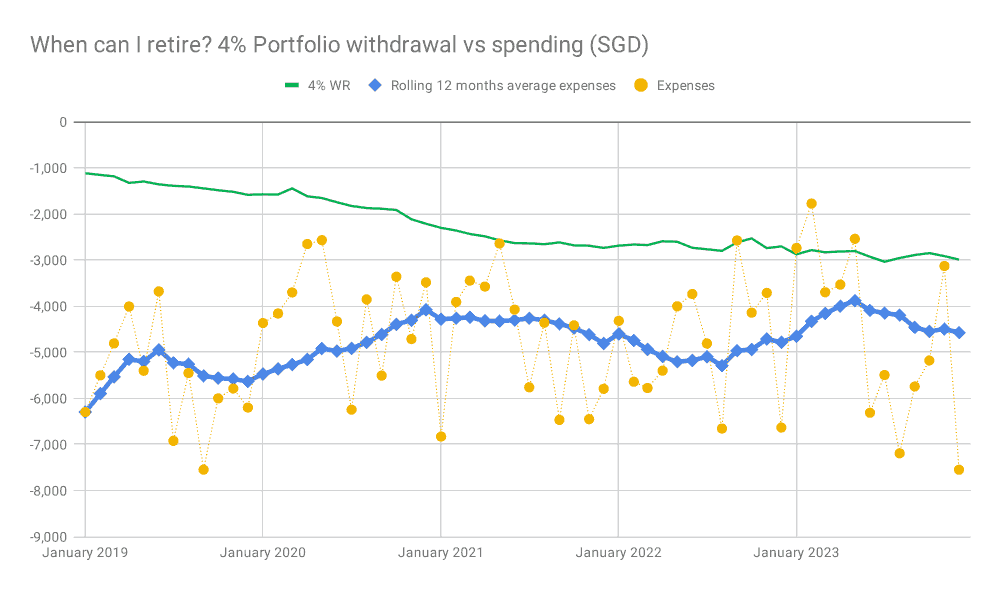
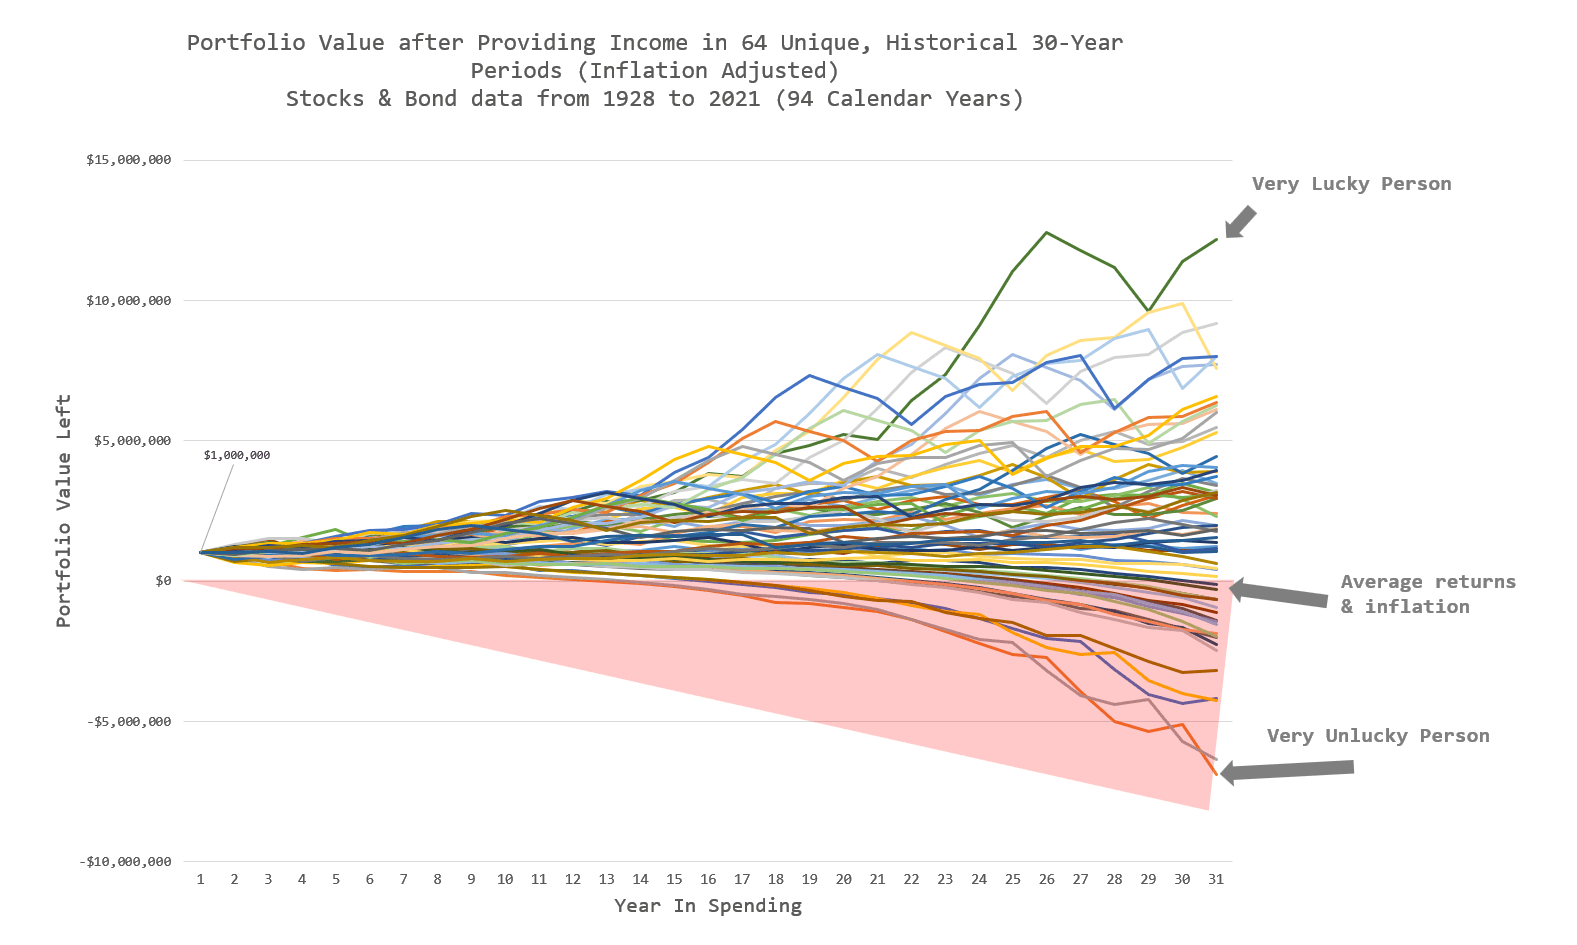
What is the Safe Withdrawal Rate for CPF LIFE, Income from Rental Property and Dividend Stocks? – Reader Question
It is Da Nian Chu Er of our Lunar Chinese New Year. Here is wishing all the good health and good wealth. I hope all …
It is Da Nian Chu Er of our Lunar Chinese New Year. Here is wishing all the good health and good wealth. I hope all …

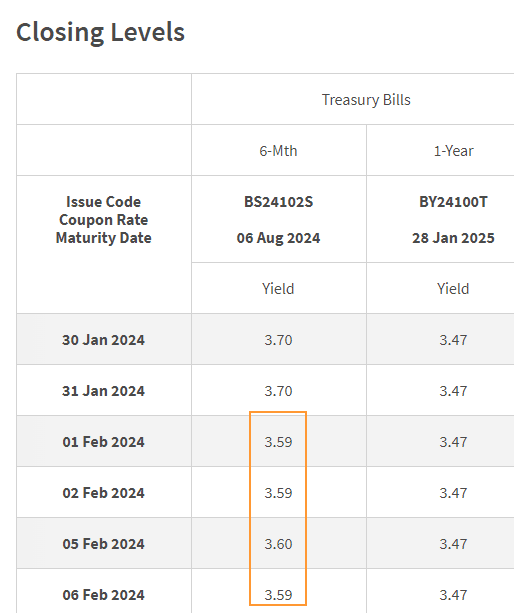
A Singapore Treasury Bill issue (BS24103H) will be auctioned on Thursday, 15 February 2024. If you wish to subscribe successfully, get your order via Internet …

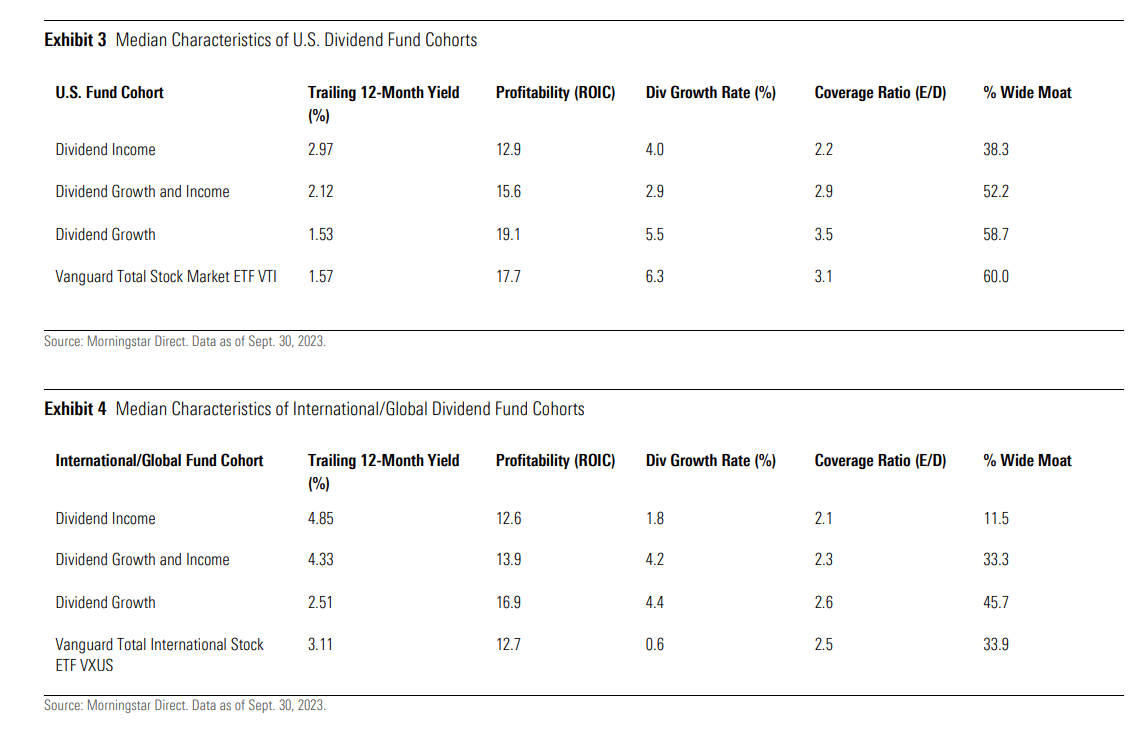
Morningstar did a 19-page paper that investigated the nature and the performance of the dividend-like funds in Morningstar Direct. If you are a curious investor …

Here is a safe way to save money that you have no idea when you will need to use or your emergency fund. The March …

I will share two articles with you today. My friend RetireBy35 found his love after reaching financial independence and eventually married. In his recent article …

My CEO Christopher Tan sat down with my colleague Jin to deconstruct his latest article that appeared in Business Times called How to make life …
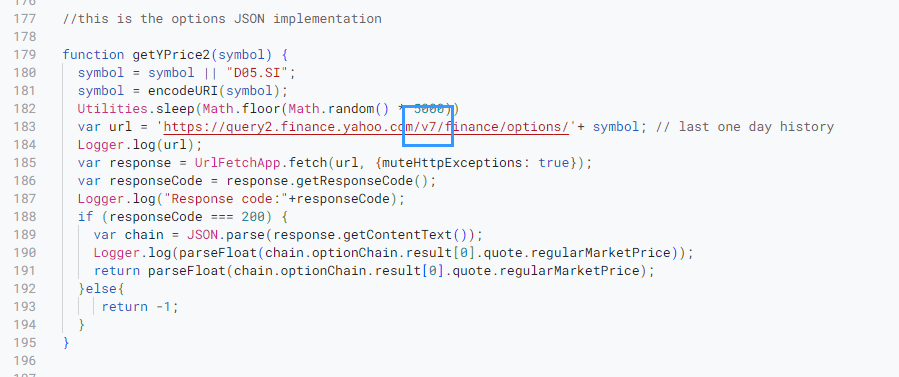

The comments and my messages were flooded with questions regarding why the prices in my Stock Portfolio Tracker is not updating accordingly. I created a …
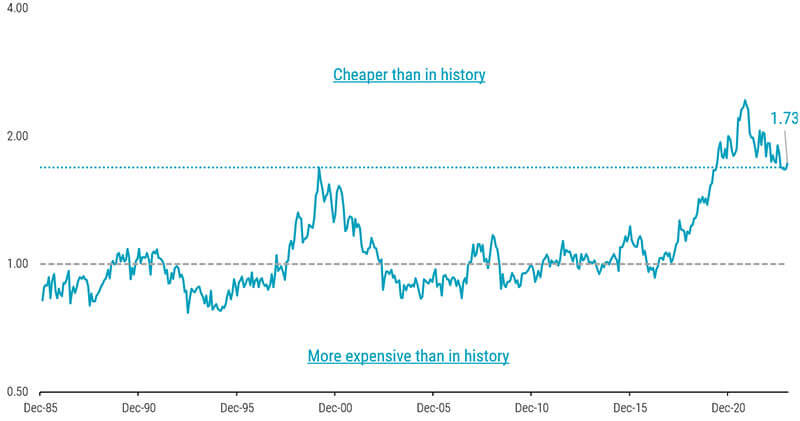

Robeco has a short and easier-to-digest article about the resurgence of the Value factor. The main idea is that value is still alive despite many …

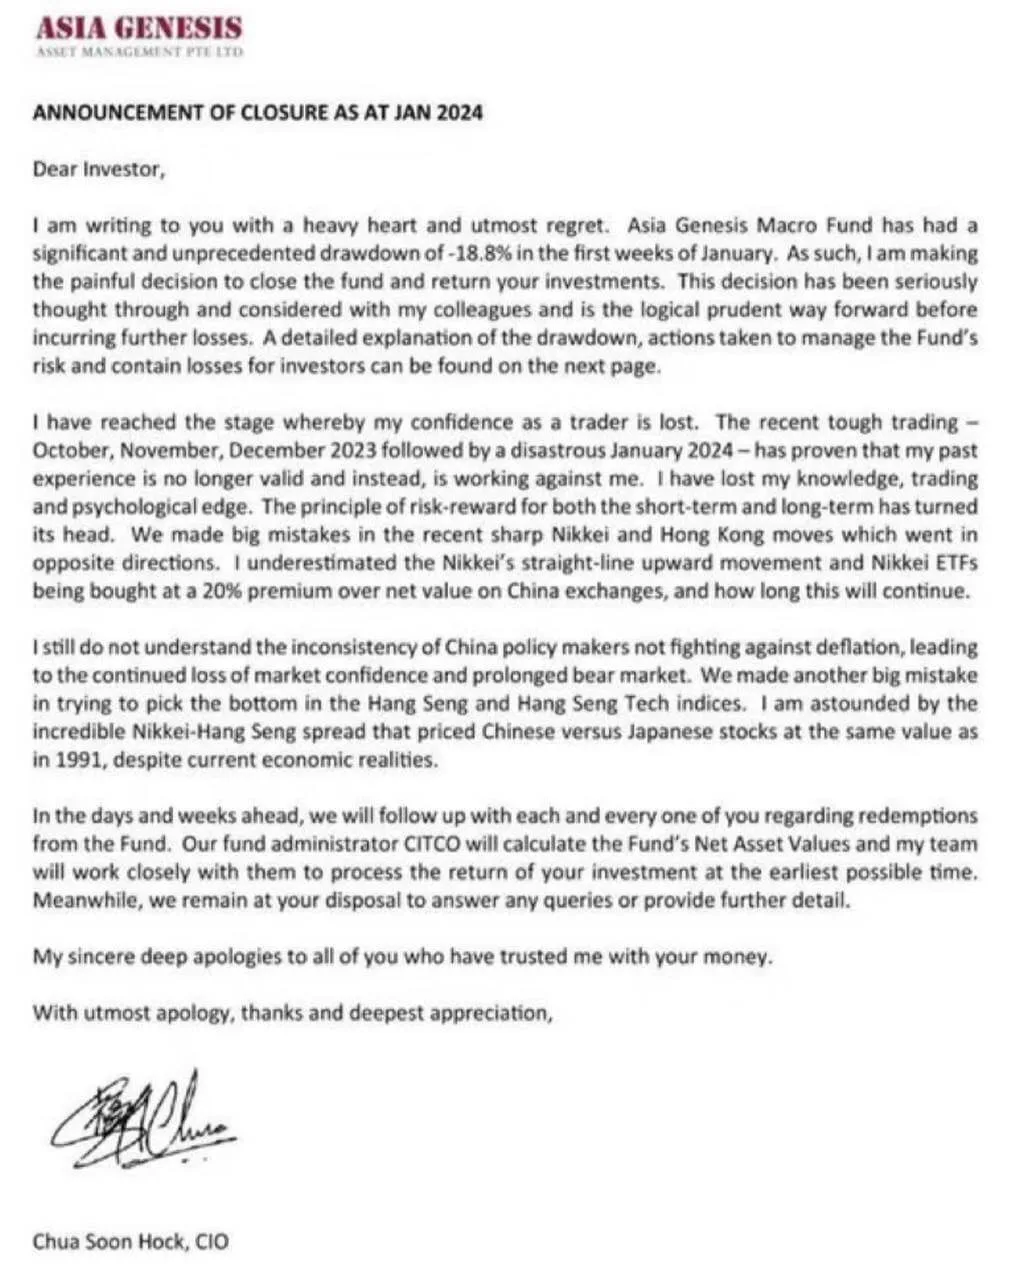
In recent news, local fund manager Asia Genesis put out a succinct letter to shareholders to explain their recent performance for their Asia Macro fund, …


This week will be lack of many updates because of the cold weather. But I might have posts like this: We are currently on a …