Today the market ended another day in light volume. As such trading in such a market requires you to be very nimble but the risk is larger than the returns. I have only 1 stock out trading this week which is Straits Asia.
Here is another analysis of whether we are in a bull phase or bear phase. John Mauldin had an article out which talks about periods of high PE generally means that going forward returns are likely to be low.
In that case, we should buy and hold when PE reaches attractive valuations, something close to 7-10 times PE. Are we there yet definately not.
I have taken extracts from the article here. Basicallly, inflation volatility will result in people placing higher discounts factor during valuation. That would bring PE down to attractive levels.
What does this mean to the investors? Although we may have enter a bull phase, if inflation volatility is rising then it might not be worth while to be in equities compare to other inflation hedges.
The data line up as you would expect, considering the relationship between inflation variability and valuation. Periods of low volatility often coincide with higher levels of valuation, and that sort of low economic variability can help to generate stock market bubbles. The plot that is second from the top shows the range of valuations when economic variability is slightly below the median. In this setting, the typical range of multiples is between 14 and 19; the 99 percentile is about 26. For above-average volatility (the two bottom plots) the typical valuation multiples are between about 10 times and 15 times the 10-year average of trailing real earnings. The highest multiple typically seen during these periods is about 20. For a reference point, the P/E on 10-year trailing earnings is currently about 16.
Currently, the level of the volatility of inflation is still low compared with the historical range. Present conditions would fall into the 2 nd plot from the top in the graph above. At about 900, the S&P 500 is roughly at the midpoint of normal valuations for this level of inflation volatility. Using the current level of inflation variability as the only measure of investment conditions, S&P levels between 800 and 1100 would represent typical range of variation. A return to 2007 highs would represent bubble valuations in the 99 th percentile.
Alternatively, if the next few years include both the effects and the reversal of the recent emergency fiscal and monetary stimulus call it the Great Unwinding inflation volatility could move above average, leading to more moderate valuations for the S&P. The 25 th and 75 th percentile for the two bottom plots in the graph above would then suggest a level for the S&P 500 of about 575 and 850. An extreme in the 99 th percentile would be about 1150 on the index.
Investors may regain their exuberance and lack of risk aversion during the next couple of years, but it seems unlikely. The 2003-2007 cyclical bull market will very likely go down in the books as an outlier. It’s extremely rare for investors to push stock prices back up to near bubble levels immediately following a prior bubble. The recent bull market, coming on the heels of the technology and dot-com crash, was a rare occurrence where leverage, easy credit, a housing market bubble, record profit margins, and inflated earnings (in hindsight), created an atmosphere where investors were once again willing to bid stock prices to (ultimately unrewarding) long-term levels.
Secular Bear Markets and the Volatility of Inflation
It’s not only the level of volatility and uncertainty in the economy that matters to investors, but also the trend and the persistence in this uncertainty. Shrinking amounts of volatility in the economy creates an environment where investors are willing to pay higher and higher multiples for stocks, while growing uncertainty brings lower and lower multiples. And while there are cyclical gyrations in the volatility of inflation and economic performance, there are also secular trends. These secular trends in the volatility of inflation closely overlap secular stock bull and bear markets. (Secular markets are often defined by their primary trend up or down – even if over shorter periods they move counter to that trend.)
These secular trends can be seen in the first set of graphs below, which show the three secular bull markets of last century which occurred from 1918 1929, 1950 1963, and from 1982 2000. The blue lines (scaled on the left axis) in each of the graphs denote the S&P 500 P/E Ratio. The red lines (scaled on the right axis) track the volatility of inflation during each period. The black dotted lines show the linear trend of the volatility of inflation.
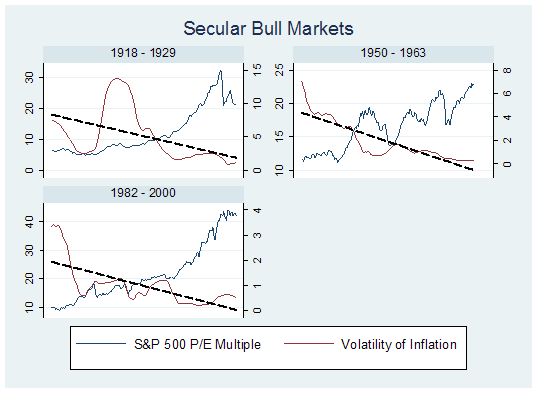
The graphs show that secular bull markets are fueled by economic volatility that trends persistently lower. While there are shorter term gyrations in the volatility of inflation during these periods, in all three, the longer-term trend was lower. The uncertainty faced by investors declined noticeably during each secular bull market, and the end of each bull market usually coincided with a few years of very low economic volatility which helped the markets move into steeply overvalued territory in each case. When that trend in economic volatility abruptly changed, the secular bull markets came to an end.
You can see the aftermath in the next set of graphs, which show the same interaction of market valuation and the volatility of inflation, but in this case during the three secular bear markets of last century, and the secular bear market beginning in 2000.
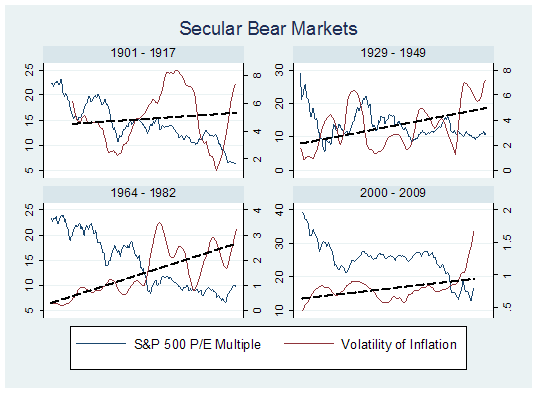
The graphs show that secular bear markets have consistently coincided with rising levels of inflation volatility. In each case the level of economic volatility grinded higher throughout the secular bear market. Increasing economic volatility is what helps chaperone multiples from overvalued territory to deeply undervalued territory. It’s the uncertainty of the stability in the growth rate of the economy and the uncertainty of the price trend that discourages investors. Piles of behavioral finance research show that investors overweight recent trends in their decisions. As uncertainty climbs, investors push multiples lower and lower assuming this uncertainty will be perpetual, eventually pricing stocks at generational lows.
It’s important to note that during the current secular bear market, the volatility of inflation has mostly been well contained. The cyclical bear market of 2000-2003 although aggravated by the recession of 2001 was mostly about valuation adjustment. Stocks moved from spectacular levels of overvaluation to moderate overvaluation, and at the recent lows, to slight undervaluation. Valuations going forward may show their typical sensitivity to economic uncertainty, and for this reason, the change in the slope of the volatility of inflation over the last two years is troublesome. The level of inflation volatility is still low, relative to the peaks reached during prior secular bear markets. If the level of inflation volatility continues to increase, it will become more difficult to argue that the secular bear market has come to an end.
The graphs above show that the secular bear markets of last century shared three characteristics. They each lasted for more than 15 years, they each ended at extremely attractive levels of valuation (generally about 7-9 times trailing 10-year earnings), and , and they each endured many years of growing volatility in output and inflation, which eventually created the mindset for investors to price stocks at attractive levels of valuation. The current secular bear market can claim none of these characteristics yet. Any increase in economic volatility during Great Unwinding of the next few years will be crucial in determining the outcome for stocks.
Kyith is the Owner and Sole Writer behind Investment Moats. Readers tune in to Investment Moats to learn and build stronger, firmer wealth foundations, how to have a Passive investment strategy, know more about investing in REITs and the nuts and bolts of Active Investing.
Readers also follow Kyith to learn how to plan well for Financial Security and Financial Independence.
Kyith worked as an IT operations engineer from 2004 to 2019. Currently, he works as a Senior Solutions Specialist in Insurance Start-up Havend. All opinions on Investment Moats are his own and does not represent the views of Providend.
You can view Kyith's current portfolio here, which uses his Free Google Stock Portfolio Tracker.
His investment broker of choice is Interactive Brokers, which allows him to invest in securities from different exchanges all over the world, at very low commission rates, without custodian fees, near spot currency rates.
You can read more about Kyith here.
- My Dividend Experience Investing in UCITS iShares iBond Maturing in 2028. - April 23, 2024
- We Invest into Popular Funds When They Are Popular, Exactly When They Started Turning to Shxt. - April 22, 2024
- Meal Prep 2.0 – Cooking Your “Go-to” Meal that You Look Forward to Eating Everyday. - April 21, 2024