Vanguard published its economic and market outlook for 2021 not too long ago.
I thought that there are some interesting data on investing, in relation to the world that we lived in, that we can take-away.
How the Recovery will Progress
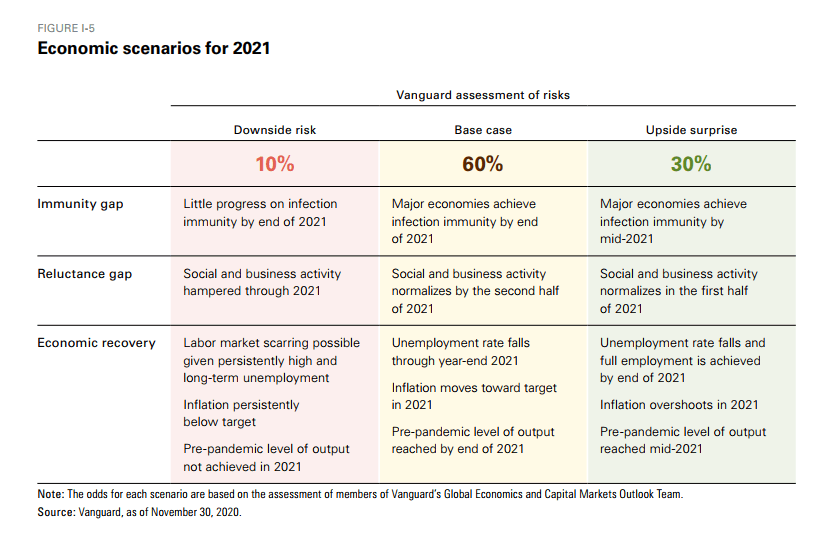
Very much of the economic recovery will be based on how fast things returned to normal. Productivity, inflation and employment rates depend on activity returning to normal.
They look at things in terms of probabilities and likely outcomes. The ramification to various regions will depend on the trajectory of the growth rates.
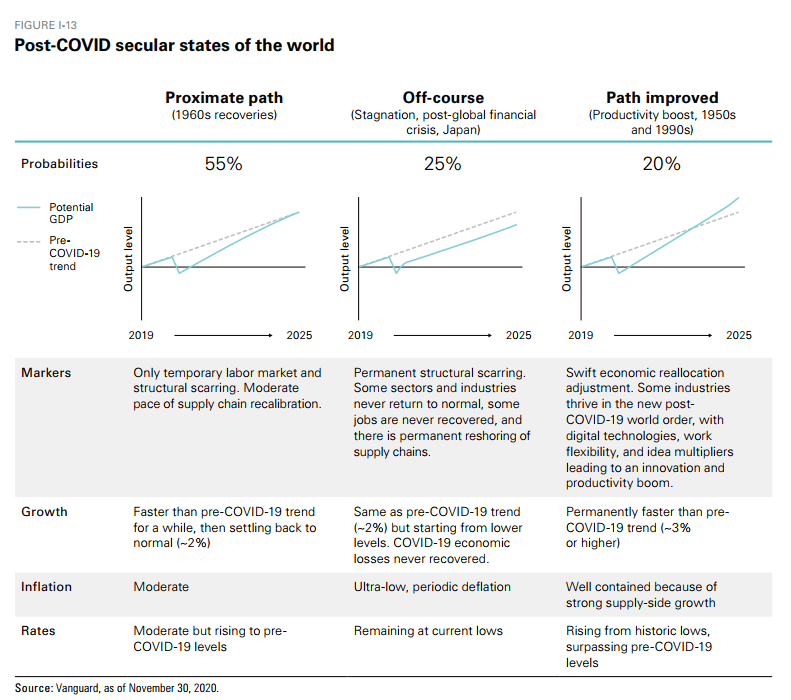
Vanguard thinks it will be some acceleration before returning to the same-old-same-old slow growth rate that we have grown accustomed to pre-pandemic.
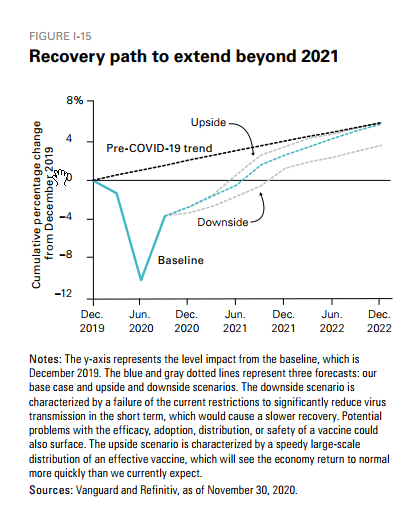
In any case, we should be expecting this to be the year we try to return to normalcy. The downside path will extend even further beyond 2022. I suspect not every region will recover at the same pace.
Inflation to Be Scary and Tame at the Same Time

With all the money printing, a lot of us are anticipating that inflation will run sky high in the future.
The reality may be very uneven inflation.
As we are recovering, technology and unemployment will be deflationary and disinflationary respectively. These should control inflation.
However, as countries try to return to the norm, it is likely we will see a few portlets of demand and supply mismatches and this would cause the cyclical bounce observed in the chart above.
Whether inflation will return to normal or not is unknown. Professor Jeremy Siegal a few months ago believes it is very plausible the US will see a one time spike in inflation (maybe 10%?) before things normalize (stay at the point of increase)
Downturn in the Equity Market Possible
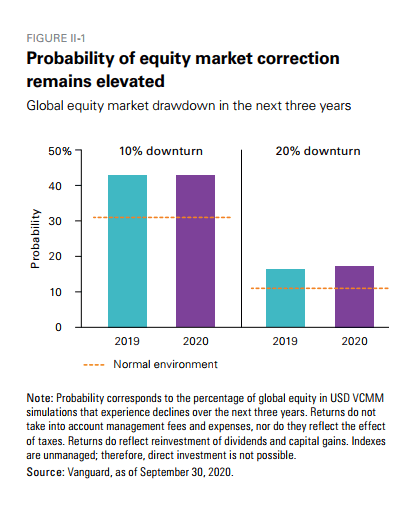
Due to the speed of recovery, Vanguard believes that the risk of a sharp downturn, defined by a 20% downturn remains possible.
I think a good takeaway for readers is to pay attention to the orange line. The line brings to our attention that there is a 30% probability a 10% downturn will occur and a 10% probability a 20% downturn can occur.
For the past 15 years, there are a lot of 10% down turn within every year. This is almost a given (and perhaps something that you could factor in, if you are adding on to your portfolio annually)
Valuations Based on Adjusted CAPE, Remains Fairly-Valued
Market valuations affect a lot of things in our investment or financial planning. We do not wish to buy things when things are expensive.
When things are expensive, we do not wish to use an initial withdrawal rate that is too high when we are assessing if we have enough to retire.
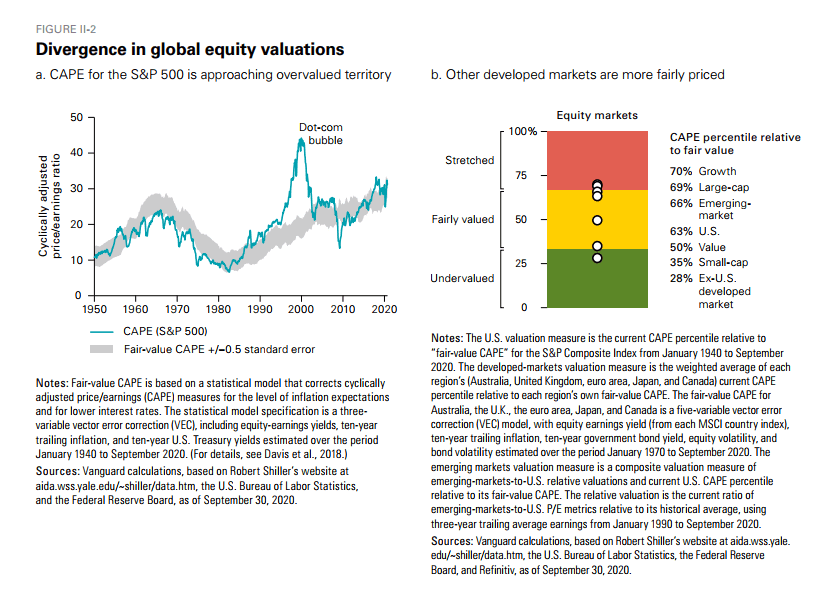
Robert Shiller’s cyclically adjusted price/earnings ratio (CAPE) is a favourite of many investments and some academics in their planning. It is slow-moving because it factors in the past 10 years earnings. It allows a decent measurement of changing economic and financial conditions.
I think Vanguard did a sensible thing by adjusting the traditional CAPE based on interest rates and inflation levels.
What is fair or overvalued depend on what equity is competing against and thus adjusting for interest rates feel sensible.
The grey area is where the adjusted CAPE is determined to be fair value. The S&P 500 is at the upper bound of the range.
Non-US developed markets appear to be at the low end of fair value (not in the diagram) and emerging markets are slightly overvalued after adjusting for their higher risk and higher earnings yields required by investors.
If you are determining if you are ready to retire based on the initial withdrawal rate, given the CAPE, it might be worthwhile to take closer to 1 divide by CAPE. If the CAPE is 30 times today, that would mean you should be conservative and see if you can live on a 3.3% initial withdrawal rate (1/30).
You can also observe the valuation breakdown for various equity group.
Equity Markets 10-Year Return Outlook
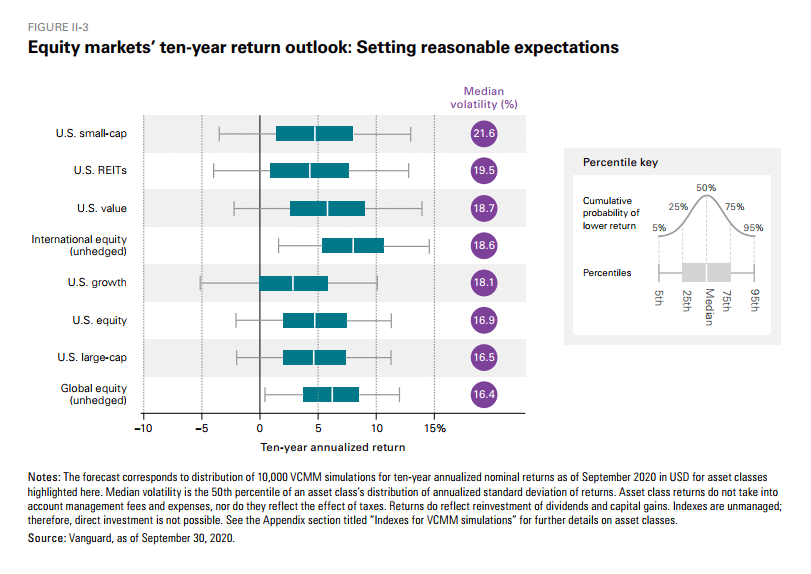
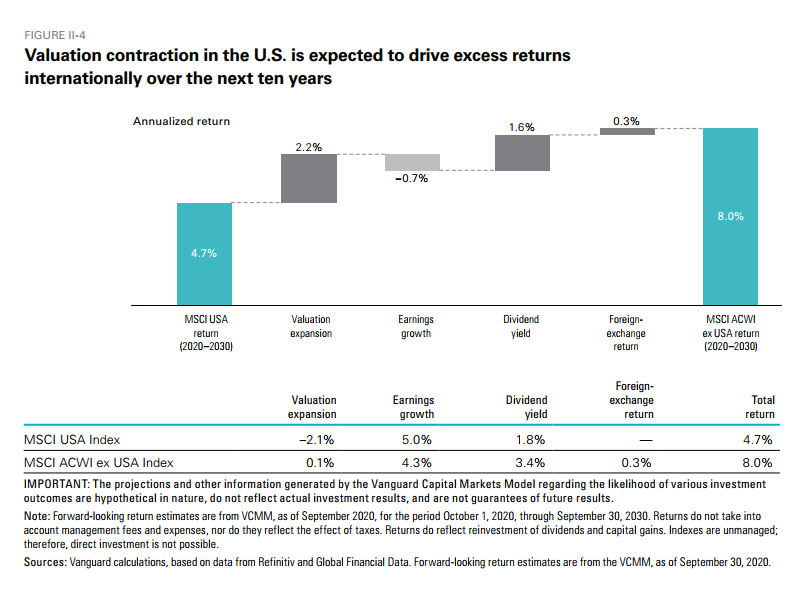
Expected return outlook for non-US equity markets is in the 7-9% range, higher than US equity.
This is thanks to more reasonable valuations and a higher dividend yield.
You are probably going to say this is bullshit considering how many companies do not track GAAP earnings so well nowadays.
Value to Outperform Growth in Upward Trending Inflation Environment
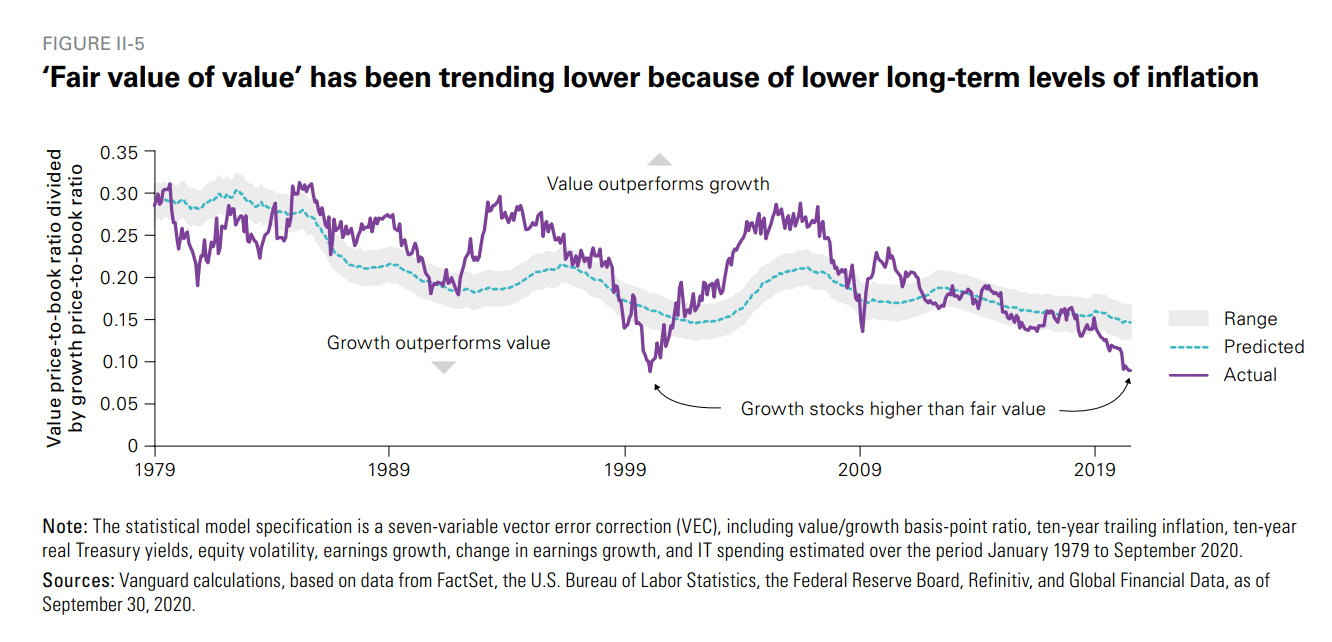
Growth stocks (particular large-cap stocks) have outperformed value in the US market.
Vanguard’s research indicates that a value premium does exist. The recent outperformance of growth stocks can be partially explained by downward-trending long-term inflation levels and the lack of material acceleration in earnings growth over the last decade.
Lower inflation levels are more beneficial to growth stocks because of the longer-term nature of their expected dividends.
Value stocks pay out a larger share of their earnings as dividends today, whereas the promise of dividends from growth stocks is further in the future, marking their prices much more sensitive to changes in inflation.
Vanguard finds that style rotations into value stocks form growth have occurred during periods of accelearting earnings growth across the economy.
While they do expect value to do better (1.1% excess return for value and -2.6% excess return for growth annualized)
Bonds Fairly Valued

Bond returns are easier to predict because there is a strong correlation between future bond returns and the current yield of bonds.
To get higher returns, investors would need to take on more credit risk or duration risk or both.
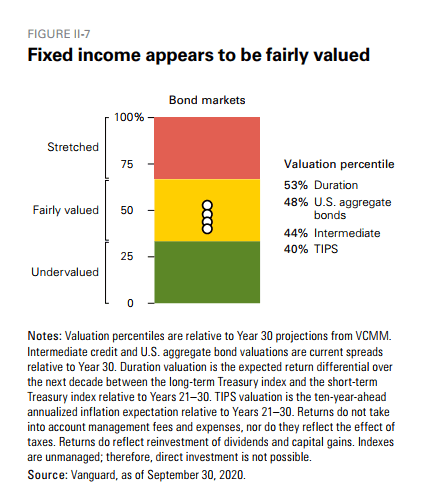
Interestingly enough, Vanguard thinks the duration risk is fairly valued. This means that they think investors will be fairly compensated to take on longer duration bonds and benefit from the forward rate movement.
This seemt to tell us that bond returns will be close to inflation expectations or below 2%.
Projected Ten-year Annualized Nominal Returns
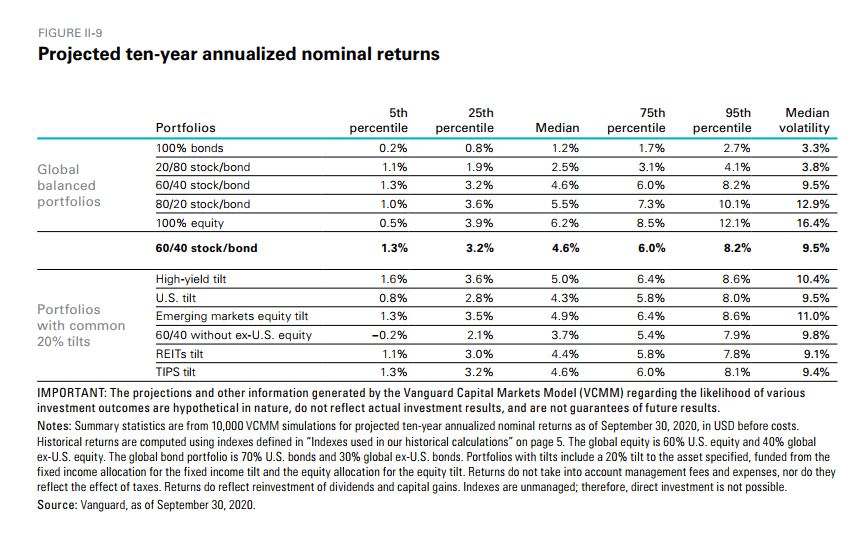
Whichever way you look at it, median returns will be moderately lower. If you are finding a suitable expected return in your planning, you might wish to use a 4-6% range.
If you are very conservative, prepare to use 1.5% as the bond rate.
Which Assets are Better as Short-Term Inflation Hedges?
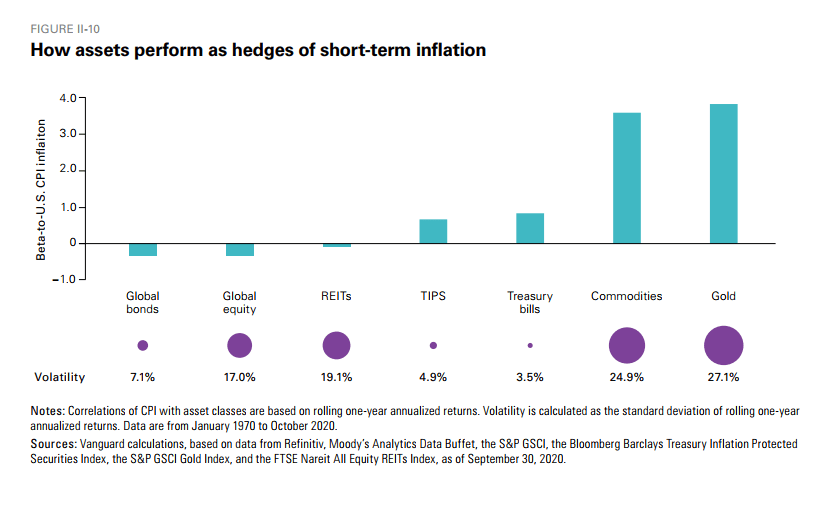
This diagram shows the inflation beta and volatility of popular inflation hedges.
From an aggregate portfolio perspective, investors looking to hedge inflation risk should look to Treasury bills, TIPS and commodities or gold over REITs and equities because of higher betas and lower volatility.
At first glance, this looks a bit unbelievable (the Treasury bills part).
I thought about it further and it makes sense. Treasury bills are shorter term so by their nature will keep up with changes in inflation.
Vanguard is referring to short-term inflation spikes, and it is believable that if inflation spikes, there will be greater volatility in the market.
While equity traditionally does well in inflationary environments, these surprises usually cause volatility in the markets on a short term.
Longer term duration bonds fare the worse. REITs, due to their hard asset property nature, may fare better.
You can read the full write-up here.
I invested in a diversified portfolio of exchange-traded funds (ETF) and stocks listed in the US, Hong Kong and London.
My preferred broker to trade and custodize my investments is Interactive Brokers. Interactive Brokers allow you to trade in the US, UK, Europe, Singapore, Hong Kong and many other markets. Options as well. There are no minimum monthly charges, very low forex fees for currency exchange, very low commissions for various markets.
To find out more visit Interactive Brokers today.
Join the Investment Moats Telegram channel here. I will share the materials, research, investment data, deals that I come across that enable me to run Investment Moats.


Do Like Me on Facebook. I share some tidbits that are not on the blog post there often. You can also choose to subscribe to my content via the email below.
I break down my resources according to these topics:
- Building Your Wealth Foundation – If you know and apply these simple financial concepts, your long term wealth should be pretty well managed. Find out what they are
- Active Investing – For active stock investors. My deeper thoughts from my stock investing experience
- Learning about REITs – My Free “Course” on REIT Investing for Beginners and Seasoned Investors
- Dividend Stock Tracker – Track all the common 4-10% yielding dividend stocks in SG
- Free Stock Portfolio Tracking Google Sheets that many love
- Retirement Planning, Financial Independence and Spending down money – My deep dive into how much you need to achieve these, and the different ways you can be financially free
- Providend – Where I used to work doing research. Fee-Only Advisory. No Commissions. Financial Independence Advisers and Retirement Specialists. No charge for the first meeting to understand how it works
- Havend – Where I currently work. We wish to deliver commission-based insurance advice in a better way.
Kyith is the Owner and Sole Writer behind Investment Moats. Readers tune in to Investment Moats to learn and build stronger, firmer wealth foundations, how to have a Passive investment strategy, know more about investing in REITs and the nuts and bolts of Active Investing.
Readers also follow Kyith to learn how to plan well for Financial Security and Financial Independence.
Kyith worked as an IT operations engineer from 2004 to 2019. Currently, he works as a Senior Solutions Specialist in Insurance Start-up Havend. All opinions on Investment Moats are his own and does not represent the views of Providend.
You can view Kyith's current portfolio here, which uses his Free Google Stock Portfolio Tracker.
His investment broker of choice is Interactive Brokers, which allows him to invest in securities from different exchanges all over the world, at very low commission rates, without custodian fees, near spot currency rates.
You can read more about Kyith here.
- New 6-Month Singapore T-Bill Yield in Late-April 2024 to Drop to 3.70% (for the Singaporean Savers) - April 18, 2024
- Golden Nuggets from JPMorgan Guide to Retirement 2024. - April 16, 2024
- Be Less Reliant on Banks and Build Stronger Capital Markets by Pushing for Better Shareholder Dividend and Buyback Yield - April 14, 2024
retirewithfi
Saturday 20th of February 2021
For CAPE based withdrawal rules, you can take a look at https://earlyretirementnow.com/2017/08/30/the-ultimate-guide-to-safe-withdrawal-rates-part-18-flexibility-CAPE-Based-Rules/. It's not inverse CAPE, there's an intercept and the CAEY multiplier (your inverse CAPE): a+b*CAEY. Full formula incorporating bond yield and cash yield: a+b*CAEY+c*Bondyld+d*Cashyld.
retirewithfi
Saturday 20th of February 2021
@Kyith,
That's because cfiresim apparently came up with this first (search for cfiresim in the article): https://cfiresim.com/faq have the a and b explained. c is the 10 year bond yield and d is cash yield if you extend the analogy.
Kyith
Saturday 20th of February 2021
Morning retiewithfi, he didn't state clearly what are A,b,c,d essentially