In July, a slide deck from JP Morgan show that based on the Cyclically adjusted price-earnings, the market is not cheap at all.
I also presented that while the market is not cheap, we should see some recovery in profit margins and earnings, just like how the markets emerge from the Great Financial Crisis.
While we are only in the second year after a major fall in the market, the speed of the recovery seems to indicate that any further runs from this would mean the markets are frothy.
And if markets are frothy, this market cycle might have run its course.
Fidelity’s Jurrien Timmer mapped out that contrary to our belief, the cycle didn’t stop at COVID-19 but this is part of a longer-term cycle.

Jurrien argued that if we assess valuation based on price to total cash flow, the general market might not look so expensive.
Total cash flow is calculated by aggregating dividends and stock buyback. I think that definition is not perfect but it does reflect the free cash flow that we can make capital decisions on.
If that is the case, then at the current price to total cash flow, we are not too different at the same point in the previous two long runs (1949 to 1968 and 1982 to 2000, secular bull markets.
Jurrien argues that valuation in a different manner does support further progression in the markets.
The full market might still have a multi-year high.
I think that there can be many different interpretations about the start and end of a secular bull trend. Long-time US financial blogger Barry Ritholtz argue that the bull should start from breaking out of the previous bear and that would be in 2013.
The important takeaway is there can be many different metrics people draw out.
This is the first time I see a price-to-total-cash used. If you Google this up, you would find very little content on this.
There seems to be a fundamental driver for a total cash flow argument. Buybacks and dividends are financial returns investors should get, and they originate mostly from cash flow.
To do it on such a wide level? First time I see it, not sure what to make of it.
How does US Corporate Profit Look?
If (E) is such an important component of a country price-to-earnings ratio, how does corporate profit look, in the context of history?
Recently, I came across the work of an experienced economist Scott Grannis and he has a few charts on how the US corporate profit look. :
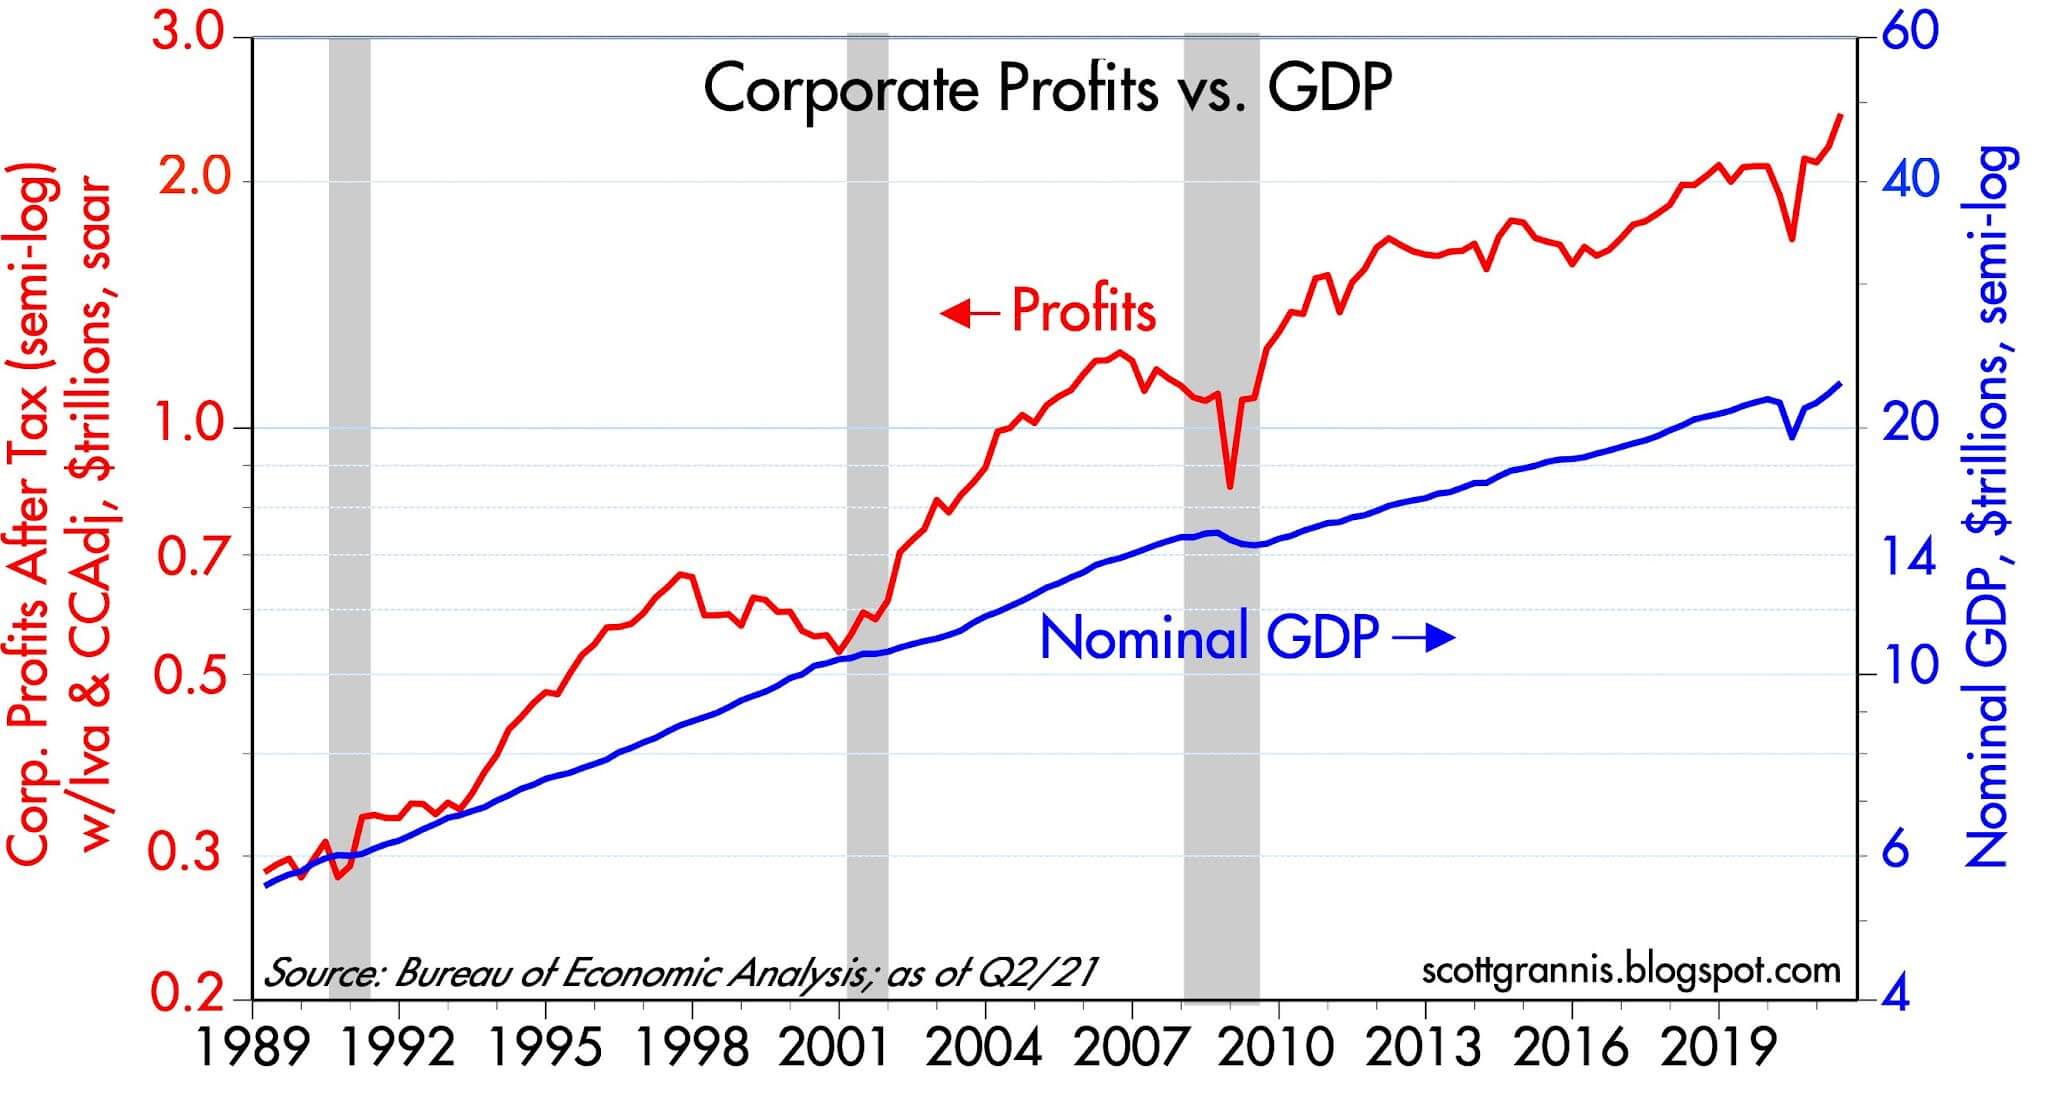
Redline is the economy-wide corporate profits versus the blue-line nominal GDP. Both are at all-time highs and corporate profits are faster than GDP.
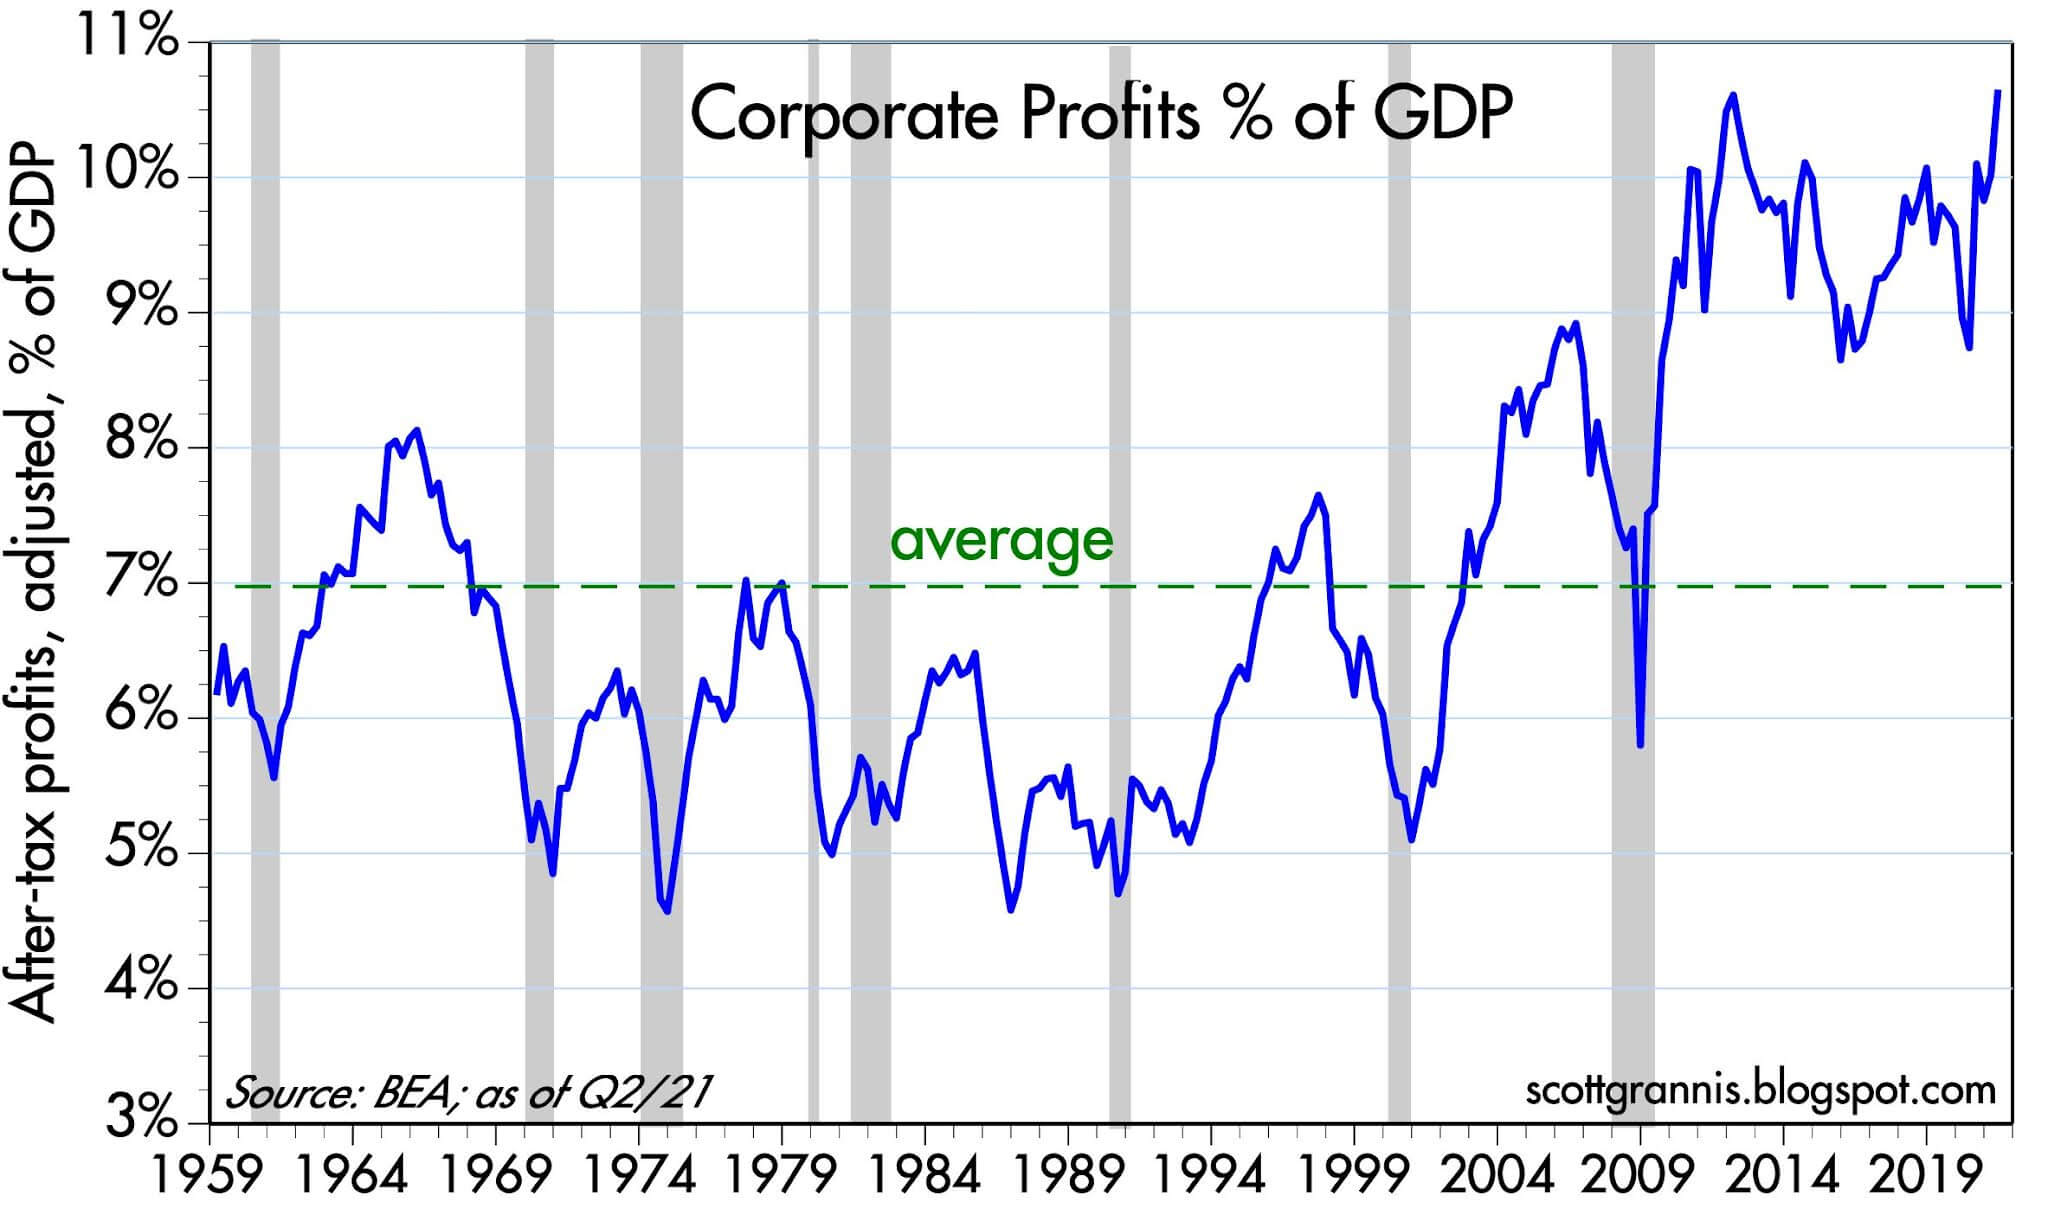
This chart shows the percentage of corporate profits as a proportion of nominal GDP. Since 2009, corporate profits have been a higher percentage of GDP.
It is like the corporate kicked up a gear.
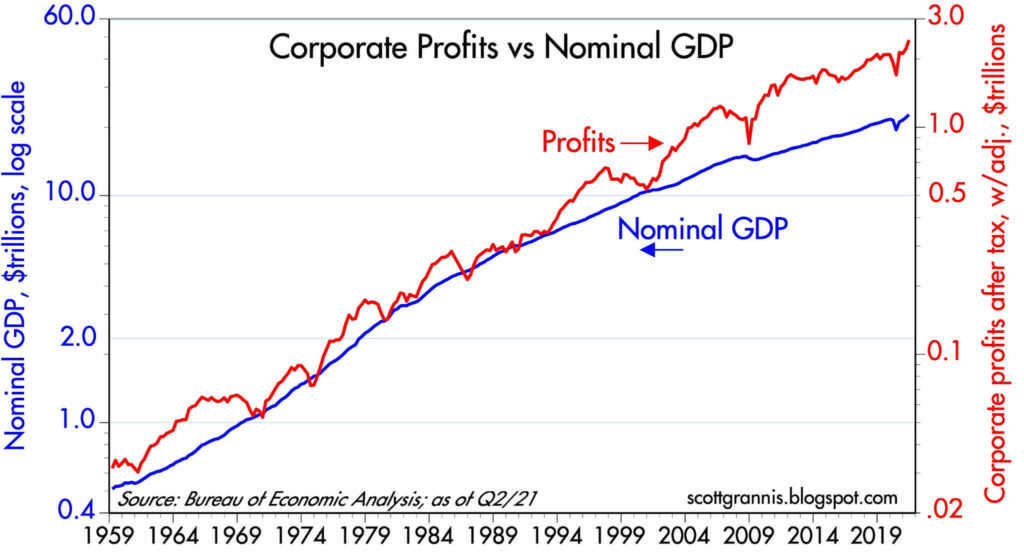
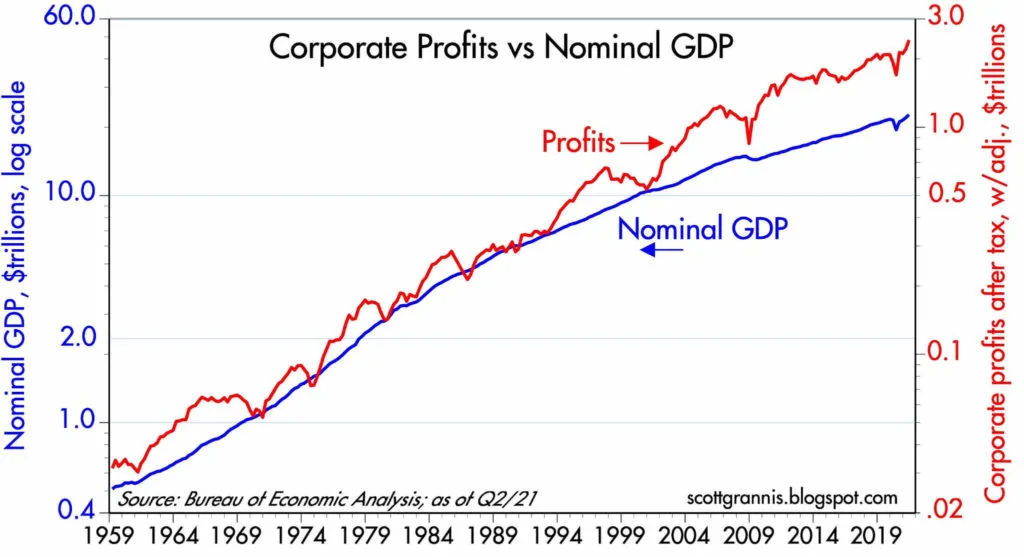

This one is a longer-term chart of the first corporate profits versus nominal GDP.
What we notice is that since the 1990s, corporate profit starts to move away from GDP.
Grannis mentioned that bearish investors in the past commented that profits should be mean-reverting. This means that it should come back down to the nominal GDP.
Grannis’s argument is that the rise of globalisation, especially China’s boom have enabled successful firms to operate in a much bigger market and more possibilities.
This is where we remember that the Price-earnings of the market stayed above 20 times since the 1990s. If we are using less than 20 times price earnings as a signal to buy more equities, we would not have entered.
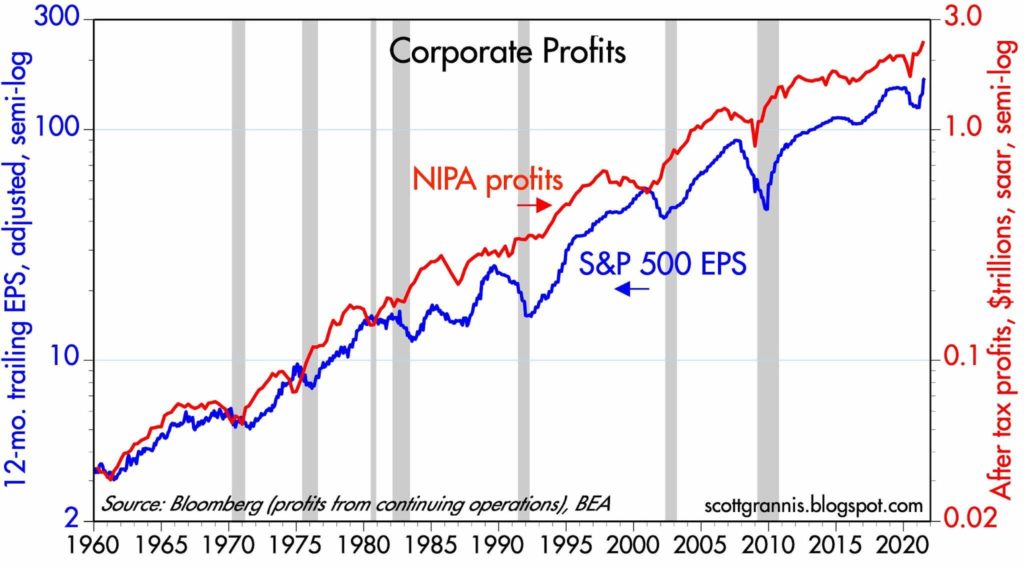
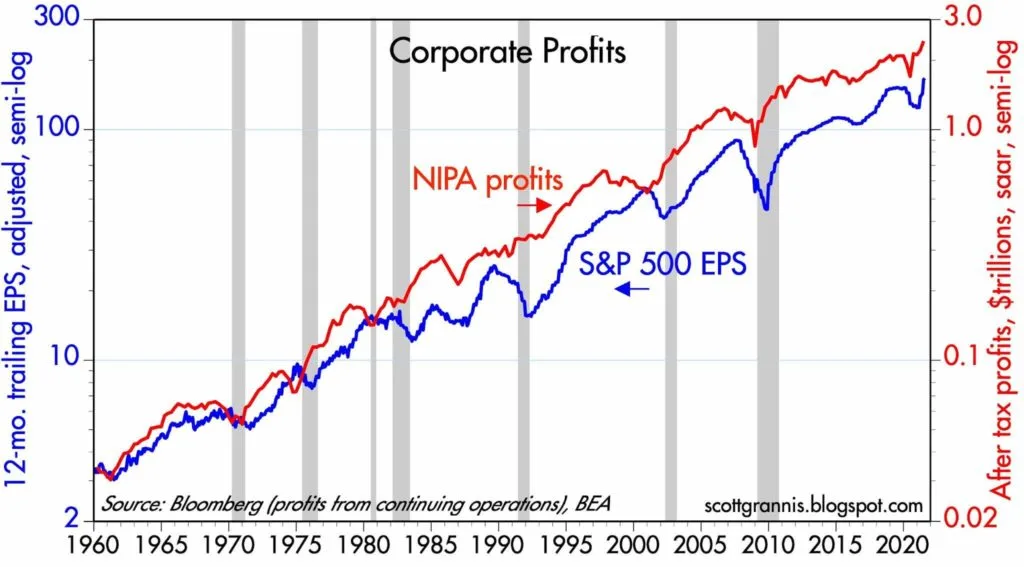
NIPA profits stand for national income earned from current production by US corporations. Since national income is defined as the income of US residents, its profit component includes income earned abroad by US corporations and excludes income earned in the US by foreign corporations or their subsidiaries.
Income consists of receipts from current production less associated expenses. Receipts exclude income from dividends and capital gains. Expenses exclude bad debts, depletion and capital losses.
If you look at the chart both kinds of profit measures track each other well over the years. It looks like NIPA profits is heading higher but in the comments, you can see someone mention that there are changes to how NIPA is calculated and this might affect its future trend.

Grannis used the NIPA profits to compute the PE ratio. The traditional way of computing is to use the 12-month trailing average of GAAP reported profits.
PE still looks alleviated but not super high. But if NIPA were to get adjusted lower, then the PE may be much higher than we think.

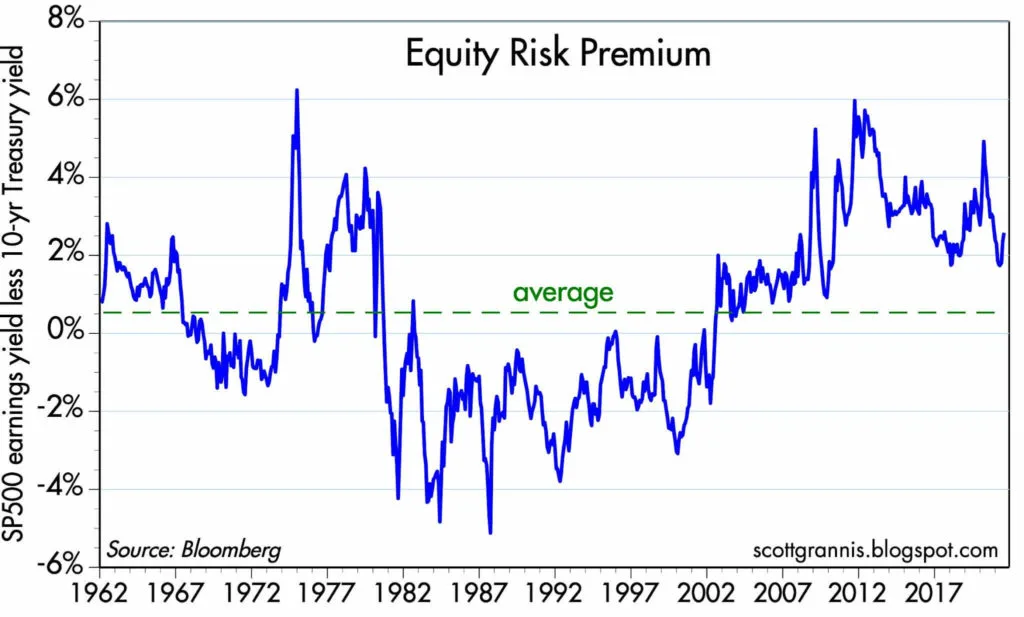
If we look at the equity risk premium versus history, there is still a risk premium. It has come down a fair bit but it is still positive.
Usually, we buy when the risk premium is at its widest.
What is fascinating is that in the secular bull from 1982 to 2000, equity risk premiums have been below zero!
This is not all too surprising as bond yields were at their highest in the 1980s.
If we have this chart back then, would we invest in equities if the risk premium is negative?
We would probably not.
But is not investing in equities in 1982 the right decision? Probably not as well! So how useful is this essentially??
I invested in a diversified portfolio of exchange-traded funds (ETF) and stocks listed in the US, Hong Kong and London.
My preferred broker to trade and custodize my investments is Interactive Brokers. Interactive Brokers allow you to trade in the US, UK, Europe, Singapore, Hong Kong and many other markets. Options as well. There are no minimum monthly charges, very low forex fees for currency exchange, very low commissions for various markets.
To find out more visit Interactive Brokers today.
Join the Investment Moats Telegram channel here. I will share the materials, research, investment data, deals that I come across that enable me to run Investment Moats.


Do Like Me on Facebook. I share some tidbits that are not on the blog post there often. You can also choose to subscribe to my content via the email below.
I break down my resources according to these topics:
- Building Your Wealth Foundation – If you know and apply these simple financial concepts, your long term wealth should be pretty well managed. Find out what they are
- Active Investing – For active stock investors. My deeper thoughts from my stock investing experience
- Learning about REITs – My Free “Course” on REIT Investing for Beginners and Seasoned Investors
- Dividend Stock Tracker – Track all the common 4-10% yielding dividend stocks in SG
- Free Stock Portfolio Tracking Google Sheets that many love
- Retirement Planning, Financial Independence and Spending down money – My deep dive into how much you need to achieve these, and the different ways you can be financially free
- Providend – Where I used to work doing research. Fee-Only Advisory. No Commissions. Financial Independence Advisers and Retirement Specialists. No charge for the first meeting to understand how it works
- Havend – Where I currently work. We wish to deliver commission-based insurance advice in a better way.
Kyith is the Owner and Sole Writer behind Investment Moats. Readers tune in to Investment Moats to learn and build stronger, firmer wealth foundations, how to have a Passive investment strategy, know more about investing in REITs and the nuts and bolts of Active Investing.
Readers also follow Kyith to learn how to plan well for Financial Security and Financial Independence.
Kyith worked as an IT operations engineer from 2004 to 2019. Currently, he works as a Senior Solutions Specialist in Insurance Start-up Havend. All opinions on Investment Moats are his own and does not represent the views of Providend.
You can view Kyith's current portfolio here, which uses his Free Google Stock Portfolio Tracker.
His investment broker of choice is Interactive Brokers, which allows him to invest in securities from different exchanges all over the world, at very low commission rates, without custodian fees, near spot currency rates.
You can read more about Kyith here.
- My Dividend Experience Investing in UCITS iShares iBond Maturing in 2028. - April 23, 2024
- We Invest into Popular Funds When They Are Popular, Exactly When They Started Turning to Shxt. - April 22, 2024
- Meal Prep 2.0 – Cooking Your “Go-to” Meal that You Look Forward to Eating Everyday. - April 21, 2024
Sinkie
Monday 30th of August 2021
Thanks for the price to total cash flow info -- first time I'm seeing it too.
The secular bull theory has been hypothesized & analysed for the past 6 years already. I first came across it in 2017, which is basically like half of the secular bull is over!
2013 is generally acknowledged as the kick-off phase of US markets when it diverged positively from rest of the world, although the bull started in 2009. China & Asia tried to catch up in 2014 but crashed in 2015. So far India seems to be the other big economy that's following the US (and also very expensive).
If it's true that we're in a secular bull (at least from US perspective), then the 2nd half of 2020s will be the danger period. And with the amount of leverage/debt in the system, the start of the next secular bear may be worse than GFC.