Earlier this week, I did an analysis on behalf of my reader who wishes to know if he has accumulated enough financial resources to early retire at the age of 49 years old.
You can read more about this at Can I Retire Early With a $2.5 Million Dividend-Focused Portfolio?
One of the questions that I get questioned is if I factor in enough conservativeness into my analysis especially given that inflation has run rather wild.
I think these are good questions.
The reader eventually followed up with:
I know there is a PhD who owns a blog and has replicated/sliced and diced/torn apart Bill Bengen et a’s SWR study in multiple ways. Quite intriguing i must say.
I think in short, SWR must at most equate or be lower than Inflation rate for the initial 2.5M to stay intact (unless your reader plans to draw down to zero X years later )… as to what the Inflation rate will be in the long run, its anyone’s guess. But I would err on the side of caution to use at least 4% (if not higher given the current inflationary environment). YMMV.
A large part of the confusion regarding the lack of conservativeness in the safe withdrawal rate study stems from the content writers only writing about whether the rate will work without showing “how the car is manufactured”.
If we do perhaps we will look at things differently.
So to answer this reader and the previous reader, let me show you some details of the safe withdrawal rate study.
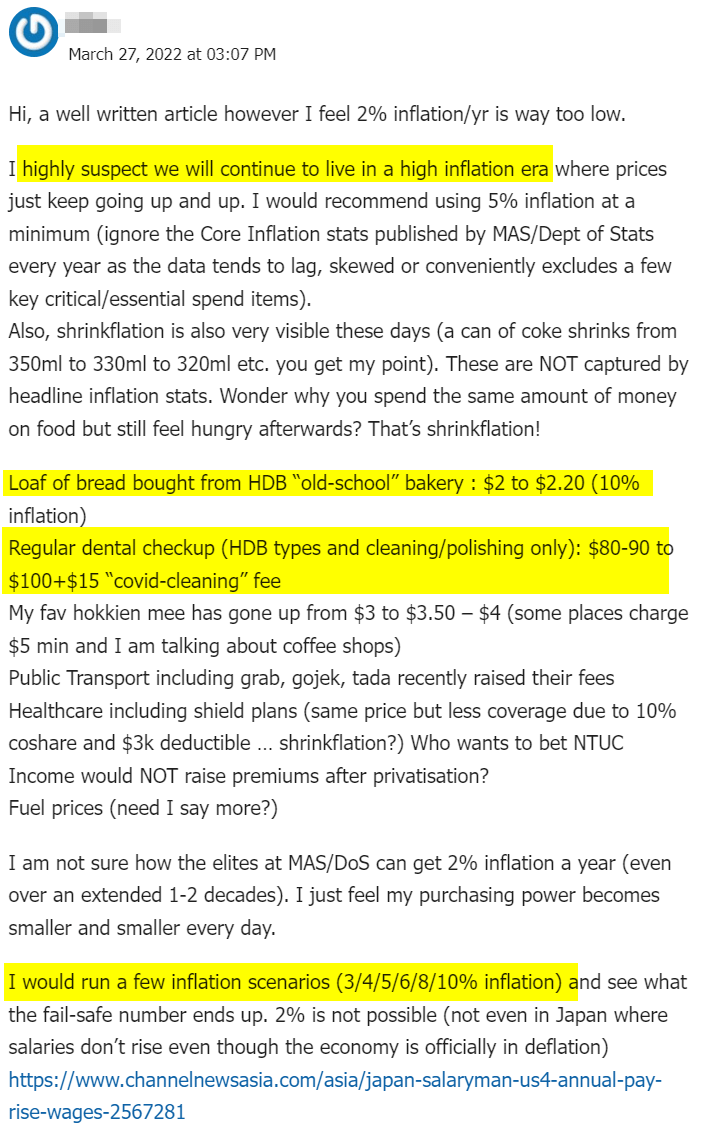
Will You Run Out of Money Spending 3% of your Initial $1 million Capital During the High Inflation 1966 to 1995 Period?
In that analysis, the client has a 72% equity 28% bond/cash portfolio.
I am going to simulate what happens when the client lives through one of the highest if not the highest inflation period from 1966 to 1995 with an S&P 500 and 1-month Treasury Bill portfolio. The 1-month is as close as I can get to something cash-like. The historical return of the 1-month Treasury bond can be rather high (3%) but that is the way things are.
If you want to stress-test your retirement system, try it against this 30-year, 50-year period. If your system lives through this period, your system is in a really good place.
Here is a simulation, using the safe withdrawal rate methodology how my reader will spend if he retires through a similar period from 1966 to 1995:
Notice that the compounded average growth, or CAGR during this period is 8.7% a year. This is probably lower than the current 10 year period but if we elongate the time, this is a return on the high side.
This may make you moderate how you look at current returns.
Notice also that during this calendar period, the biggest calendar drawdown for the portfolio was about -17% in 1974. But the portfolio experienced two consecutive years of negative portfolio and drawdown. That was a very, very bad market in 1973 and 1974.
Looking at numbers on data is kind of different from living through it huh…
Inflation during this period averages 5.47% a year.
Now… this is one of the highest 30-year inflation periods and this is a very tough period to beat (I will show you later).
If you wish to factor in higher inflation than the safe withdrawal rate study, you are looking at an inflation rate of 5.5% to 10% a year for 30, 40, 50, 60 years.
The first thing you need to ask yourself is: How does inflation actually work?
If you look at the inflation during this period… there are definitely years where inflation is 11.8%, 13.9%, 11.8%. There are those 6.2%, 5.3%, 5.6% periods. But there are also the 1.9% inflation periods.
Generally, the inflation of this period is just higher than average.
The nature of his income can be said to be very inflexible in that he requires this income for essential expenses that he cannot be flexible and reduce accordingly.
Notice that the income provided by the portfolio of my reader will increase from $35,000 a year to $140,592 a year. This is an inflation-adjusted income which means my reader preserves his purchasing power.
His portfolio grew from $1 mil to $3.2 million over these 30 years DESPITE him getting $2.2 million in total income payout during this period.
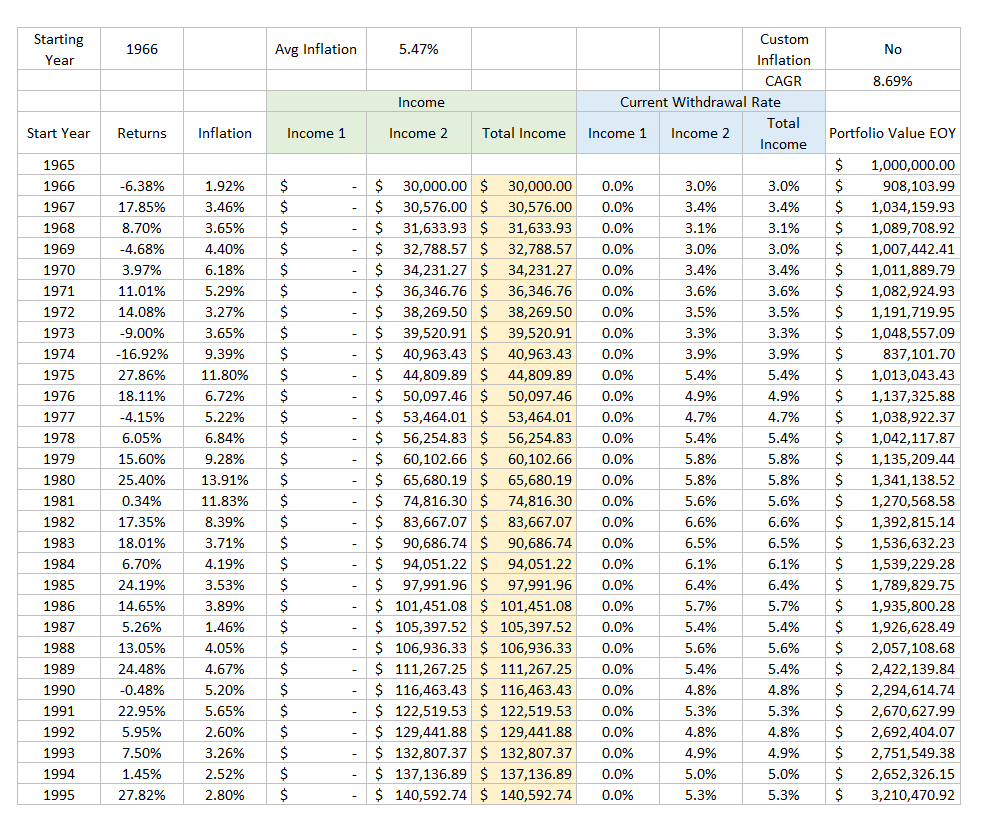
Will You Run Out of Money if You Decide to Spend 4% of Your Initial $1 Million Instead Over the High Inflation 1966 to 1995 Period?
Now spending $30,000 on $1 million may feel too low, so why don’t we bump up our spending to the standard 4% safe withdrawal rate?
This would mean we spend an initial $40,000 and adjust our income based on inflation.
After all, the average inflation rate is 5.47%, which is lower than the compounded average growth of 8.7% a year.
This should work out, right?
By bumping up the income withdrawn, the reader will run out of money 3 years earlier. This is a 33% bump up in income from $30,000.
While the average return is much, much higher than average inflation, this example shows the sequence of return matters. You cannot just look at the average rate of return.
Here are some other data:
- If the initial income is $35,000 or 3.5% of the initial, the money will last and end the 30-year with $1.3 mil
- If the initial income is $38,000 or 3.8% of the initial, the money will last and end the 30-year with $251k
All these changes with different portfolio mixes.
The money does not last also due to volatility drag. It does not mean a higher return portfolio will get you a higher income. You can read more about How Volatility Drags Your Income Portfolio in Financial Independence here.
How about if you spend an initial $50,000 or 5% that is inflation-adjusted?
Dividend income investors really like to use 5% as an estimate that they can get income, that is adjusted for inflation, and they can keep their capital intact.
In order for this model to work, your dividend income portfolio will need the income to really adjust well to inflation. If not… you will have to sell your capital.
By right… if you sell capital… your dividend income plan has already failed. If we go by a very strict definition.
Another plan adjustment they may have is to not plan with the average yield of their portfolio but a more conservative amount.
However, if you do that, there are more questions:
- How much more conservative should you be? What is the % or the absolute yield figure?
- If you be more conservative, wouldn’t that be like trying to use the safe withdrawal system without calling it one?
I think what happens is that a dividend retirement plan is put out without much quantitative thought behind it. I know because that was what I did in the past.
I wasn’t trying to risk manage the retirement plan but to force my capital to try and work.
So here is my reader spending $50,000 in the first year, then inflation adjusting it. If the income from his dividend income portfolio is not enough, he would have to sell capital to make up for it. He cannot be flexible because he needs all the income, no 1 cent less:

My reader would run out of money 11 years earlier.
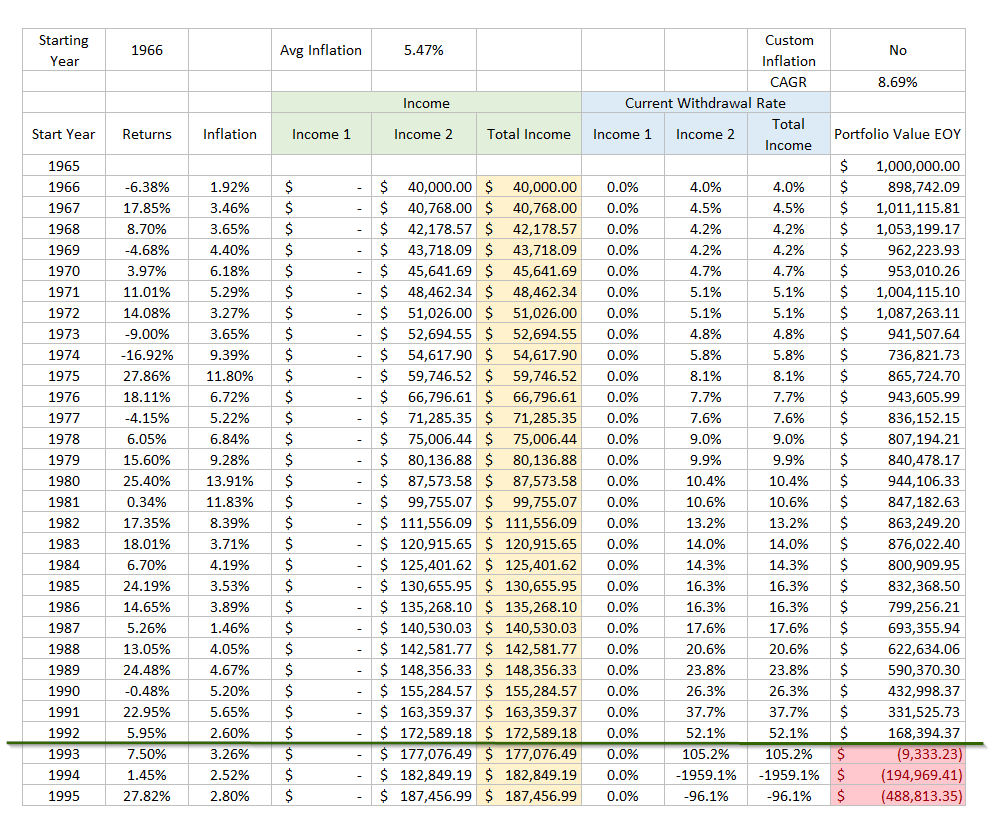
Would My Reader Run Out of Money Spend an Initial $30,000 over 60-years from 1929 to 1988?
Now, if we can get inflation-adjusted income that lasts for 60 years or more, that is pretty close to what those university endowments are trying to do. This is close to perpetual income if it can last, with a healthy amount of capital intact.
Now, we do not have so much past history, but the most challenging sequence to live through was 1929 to 1988. This is a period where you would endure a Great Depression, where the equity markets only recovered in 1954, World War 2, High inflation from 1960 to 1980, a 1987 Crash.
My reader’s $1 million would end off with $4.4 million at the end of the 60-year period. On top of this, my reader would have spent $3.8 million in income over the 60-year period. This is the worst 60-year period.
On average, my reader will be left with $75 million at the end of 60-years.
What About Those High Inflation Periods Starting in 1941?
In one of my last article, I mentioned that Jurrien Timmer and Lyn Alden thinks the closest economic period similar to today is the 1940s.
Actually, this could prove to be a good lesson.
The 30-year periods starting in the 1940s generally have average inflation of 3.3% or so thereabouts.

In this sequence of 1941 to 1970, you would notice that in the first 10 years there were three years where inflation run greater than 10%. That may feel like the situation now. However, after that, there were many years when the inflation is near 0%.
A portfolio of equities and cash did rather well.
Your Perception of Inflation Greatly Affected As You Live Through It
I guess we may live through an experience similar to the last simulation, where the inflation is rather high for 10 years but would moderate down subsequently.
There is a big difference between living through something… versus looking at it from the numbers perspective. And I feel like that is how people look at inflation now.
I remember that 13 years ago, we have a few periods where inflation is high and we also feel like if inflation is high today, inflation will continue to be high for the next 40 years.
But will that really happen?
History shows us that inflation comes and goes for developed countries. I do wish to qualify that high inflation is a byproduct of some really problematic economic and social situations. They usually occur during mass shit in certain countries such as war or sanctions due to war.
It will take a lot to push the average 30-year inflation above 5.5% and I really wonder if we should even factor that into our simulation.
Hopefully, this article shows you the level of inflation factored into the safe withdrawal rate study.
I invested in a diversified portfolio of exchange-traded funds (ETF) and stocks listed in the US, Hong Kong and London.
My preferred broker to trade and custodize my investments is Interactive Brokers. Interactive Brokers allow you to trade in the US, UK, Europe, Singapore, Hong Kong and many other markets. Options as well. There are no minimum monthly charges, very low forex fees for currency exchange, very low commissions for various markets.
To find out more visit Interactive Brokers today.
Join the Investment Moats Telegram channel here. I will share the materials, research, investment data, deals that I come across that enable me to run Investment Moats.


Do Like Me on Facebook. I share some tidbits that are not on the blog post there often. You can also choose to subscribe to my content via the email below.
I break down my resources according to these topics:
- Building Your Wealth Foundation – If you know and apply these simple financial concepts, your long term wealth should be pretty well managed. Find out what they are
- Active Investing – For active stock investors. My deeper thoughts from my stock investing experience
- Learning about REITs – My Free “Course” on REIT Investing for Beginners and Seasoned Investors
- Dividend Stock Tracker – Track all the common 4-10% yielding dividend stocks in SG
- Free Stock Portfolio Tracking Google Sheets that many love
- Retirement Planning, Financial Independence and Spending down money – My deep dive into how much you need to achieve these, and the different ways you can be financially free
- Providend – Where I used to work doing research. Fee-Only Advisory. No Commissions. Financial Independence Advisers and Retirement Specialists. No charge for the first meeting to understand how it works
- Havend – Where I currently work. We wish to deliver commission-based insurance advice in a better way.
Kyith is the Owner and Sole Writer behind Investment Moats. Readers tune in to Investment Moats to learn and build stronger, firmer wealth foundations, how to have a Passive investment strategy, know more about investing in REITs and the nuts and bolts of Active Investing.
Readers also follow Kyith to learn how to plan well for Financial Security and Financial Independence.
Kyith worked as an IT operations engineer from 2004 to 2019. Currently, he works as a Senior Solutions Specialist in Insurance Start-up Havend. All opinions on Investment Moats are his own and does not represent the views of Providend.
You can view Kyith's current portfolio here, which uses his Free Google Stock Portfolio Tracker.
His investment broker of choice is Interactive Brokers, which allows him to invest in securities from different exchanges all over the world, at very low commission rates, without custodian fees, near spot currency rates.
You can read more about Kyith here.
- Golden Nuggets from JPMorgan Guide to Retirement 2024. - April 16, 2024
- Be Less Reliant on Banks and Build Stronger Capital Markets by Pushing for Better Shareholder Dividend and Buyback Yield - April 14, 2024
- The LionGlobal APAC Financials Dividend Plus ETF Won’t Give Singapore Investors 5% Dividend Yield Always. Further personal thoughts (with some data). - April 13, 2024
Sinkie
Saturday 2nd of April 2022
Thanks for your analysis! Very useful as usual :)
To address some of readers' queries, Bengen DID consider the high inflation years & he used that period to come up with the infamous 4% rule of thumb.
But he based it on 50/50 or 60/40 portfolio allocation. And the bond allocation should be in longer-dated Treasuries, not cash-like.
I use the Portfolio Visualizer website to see how a $1 million 60/40 portfolio with 4% inflation-adjusted withdrawals would have performed. It only has data from 1972 onwards.
In a way, it is an even worse starting sequence of returns, since you only had one good year before the very bad -50% bear market of 1973-1974, plus the double-digit inflation in coming years.
This is how it performed.
1st year withdrawal at end-1972: $41,363 30th year withdrawal at end-2001: $171,971
Ending portfolio value at end-2001: $3,542,652
For the first 10 years, the portfolio was basically flat, or had big losses (during the 1973-74 bear). It only started to move up in the 2nd half of 1982 when the economy transitioned into the secular (and demographics) bull of the 1980s and 1990s.
By 1974, less than 3 years into your retirement, the portfolio had dropped to $745K with both stocks & bonds collapsing. Most retirees would have panicked sold at this point, dooming their retirement plans.
The mind, psychology, mindset, emotional stability, mental makeup ... whatever you want to call it ... is the most important aspect of investing.
Sinkie
Saturday 2nd of April 2022
Btw without withdrawals, the ending portfolio value would be a staggering $21.5 million (even with a constantly re-balanced 40% allocation to Treasuries).
Just shows the power of compounding, and the destructive effects of stopping investing or withdrawals along the way during the accumulating phase.
(That's where active salary income & savings hopefully make up for poor decisions & delays.)