A few months ago, Flirting with Models brought on a very unique guest called Cem Karsan.
Whenever I listen to these podcasts, I do not know what to expect. There are some episodes that I feel totally out-of-depth with the subject and there are some subjects that seem worth a deeper listen.
Corey Hoffstein runs a quant momentum strategy, and so most of the guests he brought on are in the same vein. This means that there will be many discussions that I don’t know what they are talking about.
But Cem’s interview is intriguing because Corey and he discussed a certain behaviour in the S&P 500 that I sort of remember in 2017.
The market seems to be grinding higher, and higher, and higher in a zombie-like pattern.
If we observed the market this year, it gives you a similar vibe as in 2017:
Near every options expiry week, which is usually the third week of the month, if there is any weakness in the S&P 500, the index would be bought.
As I write this article, we are getting towards a period where S&P 500 is showing weakness and heading into options expiry week.
It will be interesting if we will see this phenomenon again.
Cem Karsan has worked as a market maker for a long time. Cem explains that this buying the dip and pinning phenomenon on the S&P 500 is due to the actions of options market dealers.
Basically, the options market is affecting the underlying index.
In normal situations, options are a derivative on the underlying S&P 500 and should take their cue from the underlying index.
Cem frequently shares his reads on the liquidity of the market and how the environment is affected by options actions in his tweets:
The thing you will notice is that it’s filled with so many Emoji that most of us do not know what do those Emoji means.
Recently, I chance upon this YouTube video which explains why the S&P 500 is pinned to such a degree:
He probably explains things in the most layman way (with elaboration on those Emojis), but it still can be hard to comprehend for a lot of people if you do not understand how options work.
So here is my commentary in words.
The Role of Options Dealers in the Market
The S&P 500 options dealers’ role is to make the market by facilitating participants to buy and sell options.
There are many S&P 500 options dealers out there and “Gary the Gorilla” is a representative of the options dealers as a whole.
The options dealers role is not to take opportunistic directional bets.
What the options dealers sought to do is to execute delta-neutral strategies. The delta of an option is the amount of price the option is expected to move if the underlying S&P 500 moves. In another way, it shows the probability of the options becoming in the money.
A delta-neutral strategy is one where the option dealer ensure that they are delta balanced on the long and short side such that the probability of both sides being in the money is zero.
The relationship between market liquidity and implied volatility
A great market for options dealers is one where the spreads are tight. Tight spreads mean that there are enough buyers and sellers on both sides of the queue.
In such a market, the implied volatility directly reflects the liquidity of the market. If there is abundant liquidity, there are many orders on both sides of bid and ask.
If a large order comes in, it will be easily absorbed by the market. It will be difficult to move a liquid market.
Difficult to move the market means realised volatility is low, which means implied volatility is also low.
If liquidity is inadequate, the order book will be thin, a large order will be able to move the market. This will result in a higher realised volatility, and consequently in higher implied volatility.
TLDR:
- Liquidity goes up, implied volatility goes down
- Liquidity goes down, implied volatility goes up
Liquidity in the tweet is represented by bananas, which is a gorilla’s favourite food.
As the Federal Reserve practice easy monetary policy, it means that the S&P 500 have an environment of ample liquidity for them to operate.
How the typical portfolio manager is positioned in the market
After we explain the role of the market maker, he went on to explain as a cohort, how the portfolio managers are positioned.
Typically, what dominates the portfolio managers is a mixture of greed and fear.
Portfolio managers fear the downside, so typically, they wish to insure themself against the scenario where the market shits on them.
So they will buy puts on the S&P 500 to protect themselves.
The downside protection is not cheap, and thus to finance the put options, portfolio managers have to sell calls on the long end to finance the puts.
Thus, when the market is liquid, there is more demand for S&P 500 puts and more supply of S&P 500 calls.
As a collective, the portfolio managers buy puts, sell calls.
The market dealers (Gary the gorilla) will take the opposite side of sell puts, buy calls. Since both buy calls and sell puts are bullish strategies, to remain delta-neutral, the market dealers would hedge their position by shorting the S&P 500 index at the same time.
What happens when market dealers rebalance their books to remain delta-neutral
Markets move due to news flow and the underlying fundamentals.
As the S&P 500 move, the market dealers would need to rebalance their books so that they can stay delta-neutral.
The thing is… these S&P 500 option dealers control a large chunk of the S&P 500 options in the market.
So when they rebalance their books… they can affect the underlying S&P 500 market.
How much the options dealers affect the market depends on the S&P 500 option’s delta, which depends on:
- Changes in the underlying S&P 500 price
- Changes in implied volatility
- The unstoppable marching of time that is slowly guiding us all towards an inevitable death
The effects on Delta are measured by
- Gamma (change in delta with respect to underlying price)
- Vanna (change in delta with respect to implied volatility)
- Charm (change in delta with respect to the passing of time).
The market can have a few actions.
If the market is slowly grinding higher, the price gets closer to the out-of-money call options the options dealers own. In order to be delta-neutral, the options dealers would have to short more of the S&P 500 index.
If the market is grinding lower, the price gets closer to the out-of-the-money puts the options dealers sold. In order to be delta-neutral, the options dealers would have to buy more of the S&P 500 index.
So the net effect is that… the options dealers end up counterbalancing the price action:
- S&P 500 goes down, the options dealers become dip buyers.
- S&P 500 goes up, the options dealers become sellers of rallies.
So the options dealers act like the stabilizers of the market.
What you get is that this reduces the index volatility and an effect where you will observe the S&P 500 looks “pinned”.
When the options move closer towards option expiry
The delta of out-of-the-money S&P 500 options go to zero as
- The implied volatility drops
- The option approaches expiry
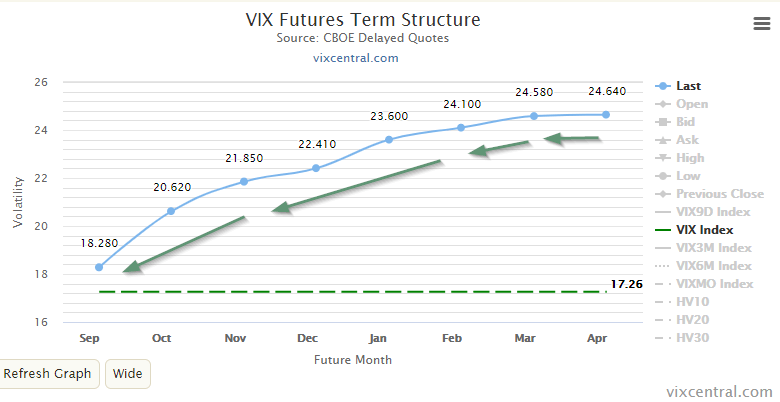
Under normal market conditions, the implied volatility term structure is in contango, which means future volatility is higher than the nearer term volatility.
As the option approaches expiry and getting closer to today, the implied volatility will roll down the term structure, we should expect the implied volatility to decrease.
This fall in implied volatility reduces delta. (Vanna)
But Vanna is not the only one reducing delta.
As time passes, the delta also decays (Charm)
So all in all, Delta gets reduced closer to options expiry.
This means the S&P 500 options dealers don’t need to hedge so much to remain delta neutral.
They can buy back “some” of their short S&P 500 positions to remain delta neutral.
But because the options dealers are so big, buying back those shorts affect the market.
So as we get closer to expiry, which is the third week of the month, we will notice that the index will move higher.
The effects of Vanna and Charm are the strongest during the second and third week of the month. This means it is strongest the week before options expiry and the options expiry week.
The Window of Weakness
As we move to the middle of the week of options expiry, the strength of the Vanna and Charm flows fade away.
As they fade away typically on the Wednesday of the options expiry week, it presents a window of weakness.
The index becomes free to do what it does again.
The options flows are not there to support the market.
It has to be said, this window of weakness does not mean the market will crash.
It just means options flows do not dictate the market and the market is open to other relationships to dictate it.
This is all good until near the end of the month, where the forces of Vanna and Charm comes back and affect the market again.
Options are becoming a bigger and bigger influence over fundamentals
The tail (options) is able to wag the dog (index) because of the rising popularity of options:

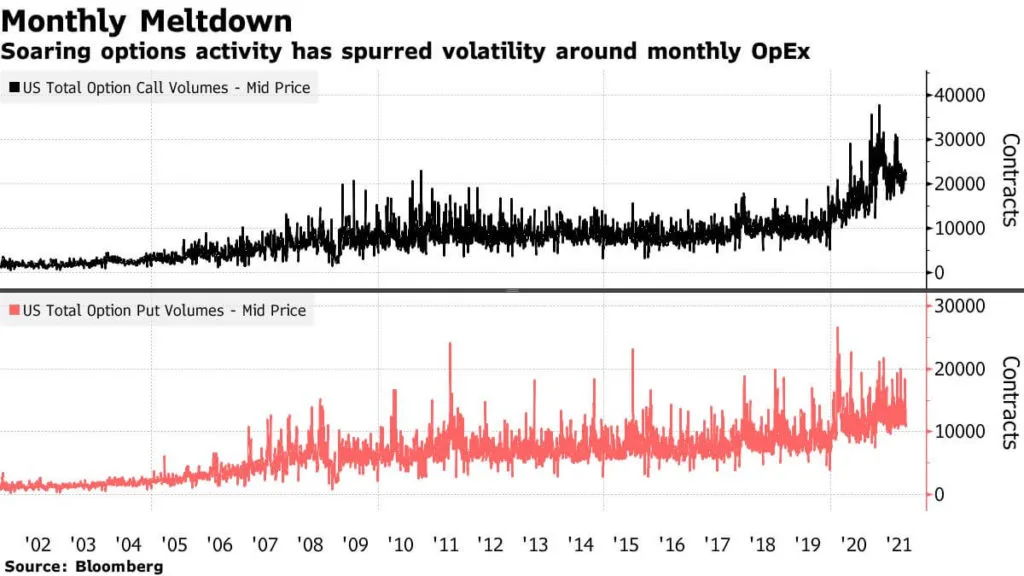
The S&P 500 is an aggregate of the biggest companies. We think the fundamentals should dictate its movement.
But perhaps in the future, options will have a greater bearing on how the index moves.
The Important Role of Liquidity
What create that conducive environment was liquidity.
Quantitative easing has really helped with this.
Thus, it begs the question of what will happen if the liquidity is sucked out of the market through tapering.
That could mean a more volatile environment.
What Could Cause a 20-30% Fall?
The scary thing is that, given how interlinked the options market is with the index, the option dealer’s actions may kill the market faster.
Squeeze Metrics explains that when many people sign up to provide liquidity via put sales, the mere sign of the scarcity of liquidity (or implied volatility going up) will trigger an automatic withdrawal of liquidity from the market right when liquidity is needed the most.
The following bell shape curve illustrates the option-implied distribution when implied volatility is trending down:
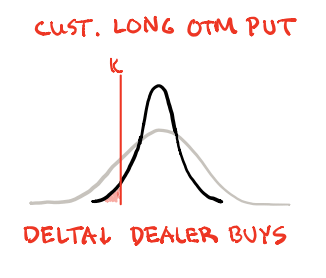
This distribution shows the range of probability the put option will expire in the money. K shows where the customer buys an out-of-money put. The original curve is the grew bell curve.
When the option approaches expiry, the Charm and Vanna flow becomes important. The range of probability outcomes narrows, hence the bell curve narrows to the black one. Customer’s K is now further out of money.
The shaded area shows how much the option dealer needs to short to maintain delta neutral. So when the implied volatility goes down, and Delta approaches zero, the shaded area becomes smaller, implying they need to short the S&P 500 less.
So they would buy back S&P 500 to reduce the shorted inventory.
This is the buy the dip effect.
But what happens when implied volatility picks up instead of going down?

It is possible that the liquidity in the options market dramatically reduced. And when liquidity goes down, implied volatility goes up.
Instead of a narrowed bell shape curve, the bell shape curve widens.
The probability of the customer’s option becoming in-the-money increases.
If you look at the shaded area, which represents how much the dealer of the options have to short to remain delta neutral, it has to expand.
This means the options dealer have to short the S&P 500 even more!

Squeeze Metrics lays out how many put options were bought versus sold over the past years.
There were periods where more options were sold than the market wishes to buy. And these periods coincide with periods of greater distress.
Is there more put selling in the current environment?
With the current low-interest-rate environment, portfolio managers, private bankers have to find alternatives to create yield for clients.
And one of the ways is to structure products around selling puts. When clients sell puts, they earn a premium upfront.
Bankers like to masquerade these options premium as yield.
If I understand correctly, some insurance companies are also doing this.
So don’t be surprised we will have an environment where the supply of puts outstrip demand.
Conclusion
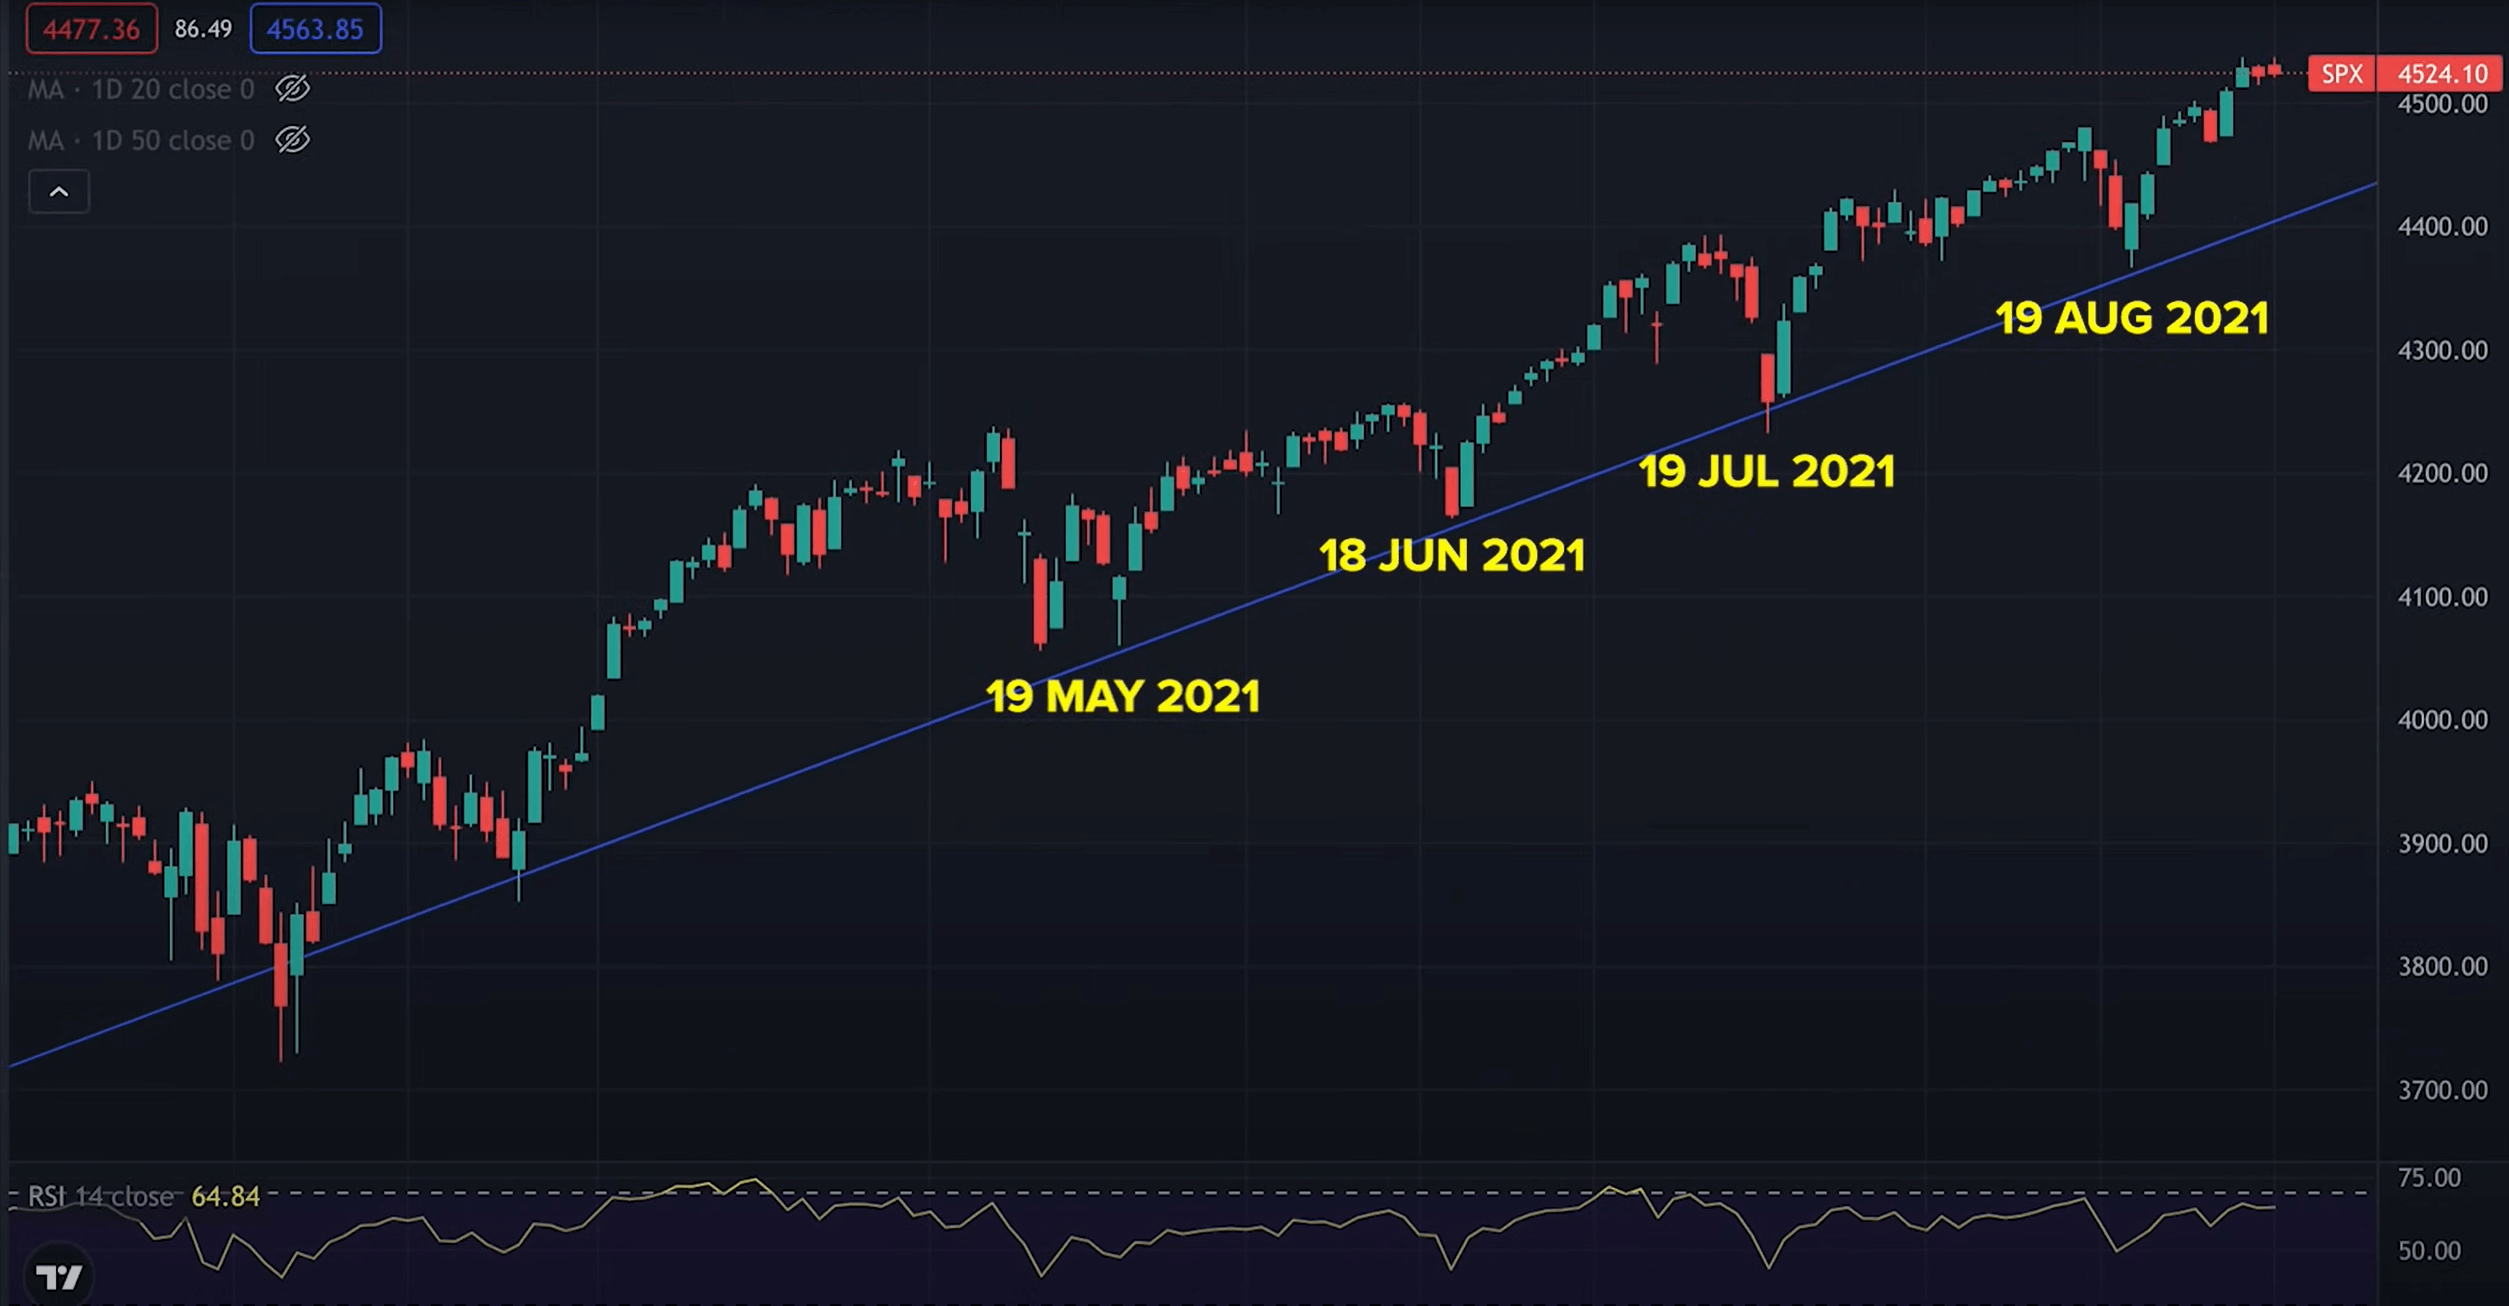
I think it is no coincidence that some of the biggest recoveries take place:
- After options expiry (Vanna and Charm flows dissipated)
- Liquidity is provided.
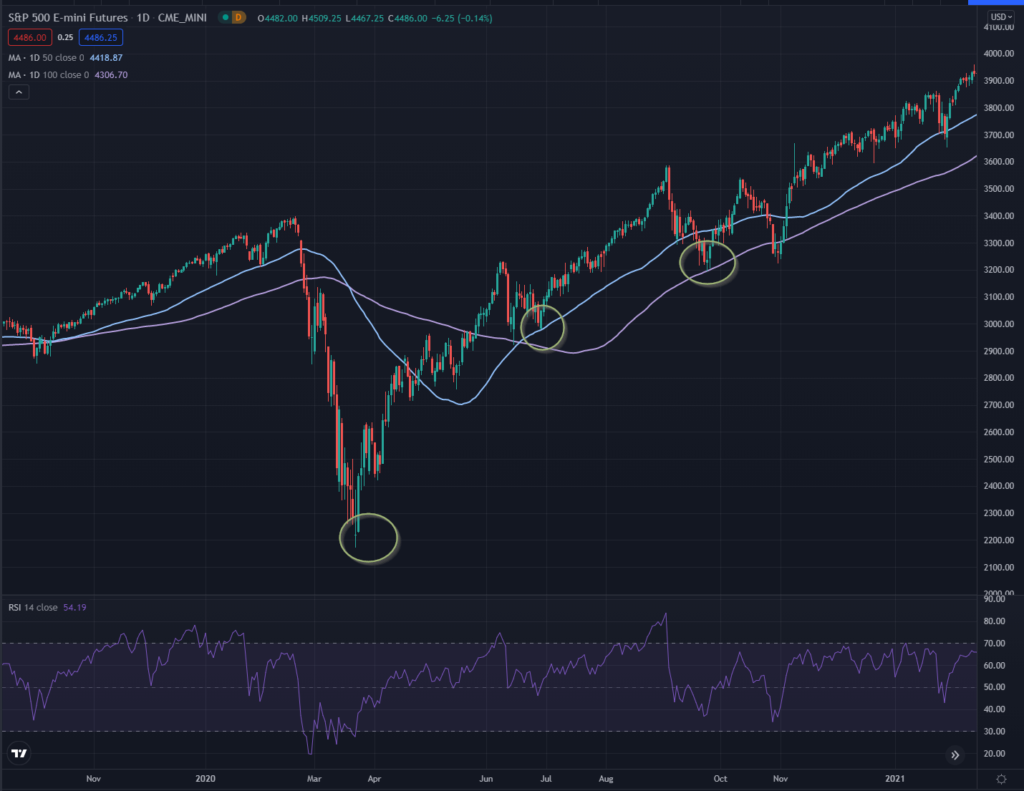
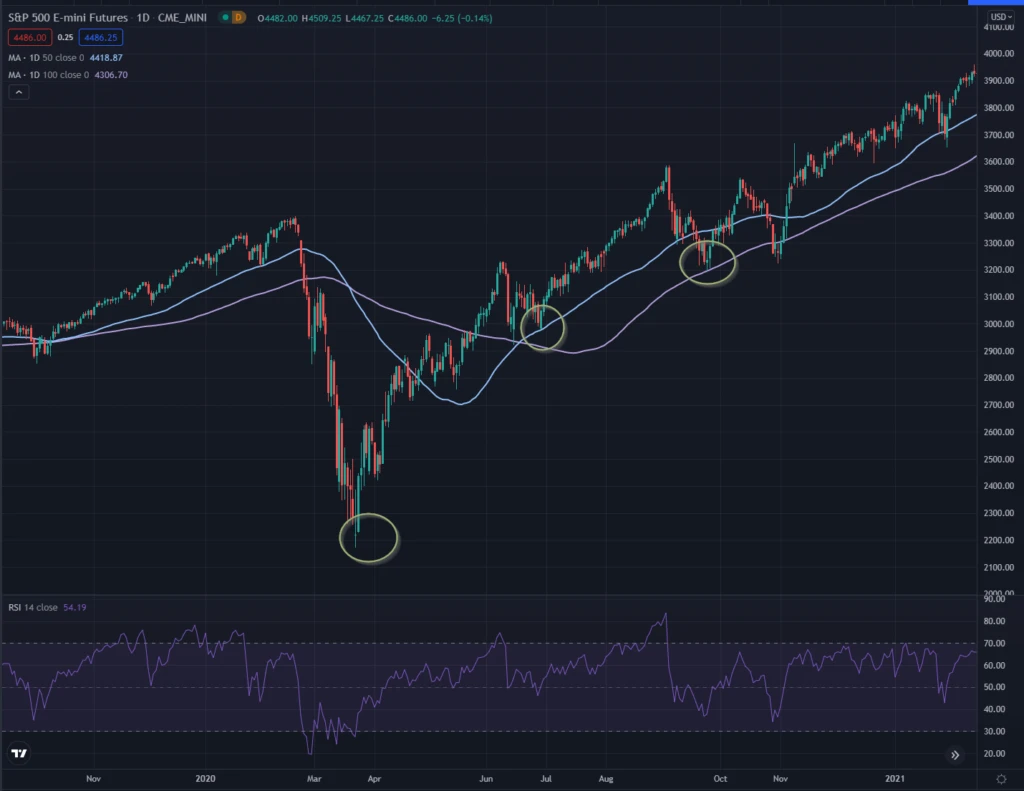
Those circles are dates immediately after options expiry.

Here is the recovery in Dec 2018.
The absence of options flow allows the market to freely move.
Understanding this better makes me gain a different appreciation of the week before and during options expiry and what happens after that.
It also makes me wary of what happens when the Fed really starts to taper later in the year.
We could have a replay of 2018.
If the Fed understands this… I wonder if they have a choice to not taper at all.
Next week, we have an options expiry and S&P 500 is currently weak. You can see if it plays out again.
I invested in a diversified portfolio of exchange-traded funds (ETF) and stocks listed in the US, Hong Kong and London.
My preferred broker to trade and custodize my investments is Interactive Brokers. Interactive Brokers allow you to trade in the US, UK, Europe, Singapore, Hong Kong and many other markets. Options as well. There are no minimum monthly charges, very low forex fees for currency exchange, very low commissions for various markets.
To find out more visit Interactive Brokers today.
Join the Investment Moats Telegram channel here. I will share the materials, research, investment data, deals that I come across that enable me to run Investment Moats.


Do Like Me on Facebook. I share some tidbits that are not on the blog post there often. You can also choose to subscribe to my content via the email below.
I break down my resources according to these topics:
- Building Your Wealth Foundation – If you know and apply these simple financial concepts, your long term wealth should be pretty well managed. Find out what they are
- Active Investing – For active stock investors. My deeper thoughts from my stock investing experience
- Learning about REITs – My Free “Course” on REIT Investing for Beginners and Seasoned Investors
- Dividend Stock Tracker – Track all the common 4-10% yielding dividend stocks in SG
- Free Stock Portfolio Tracking Google Sheets that many love
- Retirement Planning, Financial Independence and Spending down money – My deep dive into how much you need to achieve these, and the different ways you can be financially free
- Providend – Where I used to work doing research. Fee-Only Advisory. No Commissions. Financial Independence Advisers and Retirement Specialists. No charge for the first meeting to understand how it works
- Havend – Where I currently work. We wish to deliver commission-based insurance advice in a better way.
Kyith is the Owner and Sole Writer behind Investment Moats. Readers tune in to Investment Moats to learn and build stronger, firmer wealth foundations, how to have a Passive investment strategy, know more about investing in REITs and the nuts and bolts of Active Investing.
Readers also follow Kyith to learn how to plan well for Financial Security and Financial Independence.
Kyith worked as an IT operations engineer from 2004 to 2019. Currently, he works as a Senior Solutions Specialist in Insurance Start-up Havend. All opinions on Investment Moats are his own and does not represent the views of Providend.
You can view Kyith's current portfolio here, which uses his Free Google Stock Portfolio Tracker.
His investment broker of choice is Interactive Brokers, which allows him to invest in securities from different exchanges all over the world, at very low commission rates, without custodian fees, near spot currency rates.
You can read more about Kyith here.
- My Dividend Experience Investing in UCITS iShares iBond Maturing in 2028. - April 23, 2024
- We Invest into Popular Funds When They Are Popular, Exactly When They Started Turning to Shxt. - April 22, 2024
- Meal Prep 2.0 – Cooking Your “Go-to” Meal that You Look Forward to Eating Everyday. - April 21, 2024
John
Sunday 12th of September 2021
Hi,
When the dealer is short puts, he is delta positive no? Hence he'll need to short more as the market gets closer to the option strike, not long.
Kyith
Sunday 12th of September 2021
Hi John, my interpretation is that if the price falls the Delta goes up... so the right thing to do is to buy more index to counter balance that. But then based on the curve that I show, by right if implied volatility is up and delta is positive... they actually need more inventory so they should short more. So in my head I am also trying to resolve this.
Sinkie
Saturday 11th of September 2021
Higher chance of volatility as 17 Sep is quadruple witching -- expiry of index futures & options, and stock futures & options.
Tapering still likely to start Dec 2020 or Jan 2021. But will be small. Enough realist economists on the Fed to push for it to start, and not to prop up markets or make current govt look good.
Bull market still looks good for few more years. Any 10% to 20% corrections are chances to buy big on the dips.
Kyith
Sunday 12th of September 2021
Well we will see how next week.
Sinkie
Saturday 11th of September 2021
Lol back to the future --- I mean Dec 2021 or Jan 2022!