While the cryptos are having some great run-ups some investors was captivate by the the crazy price movements in copper and lumber.
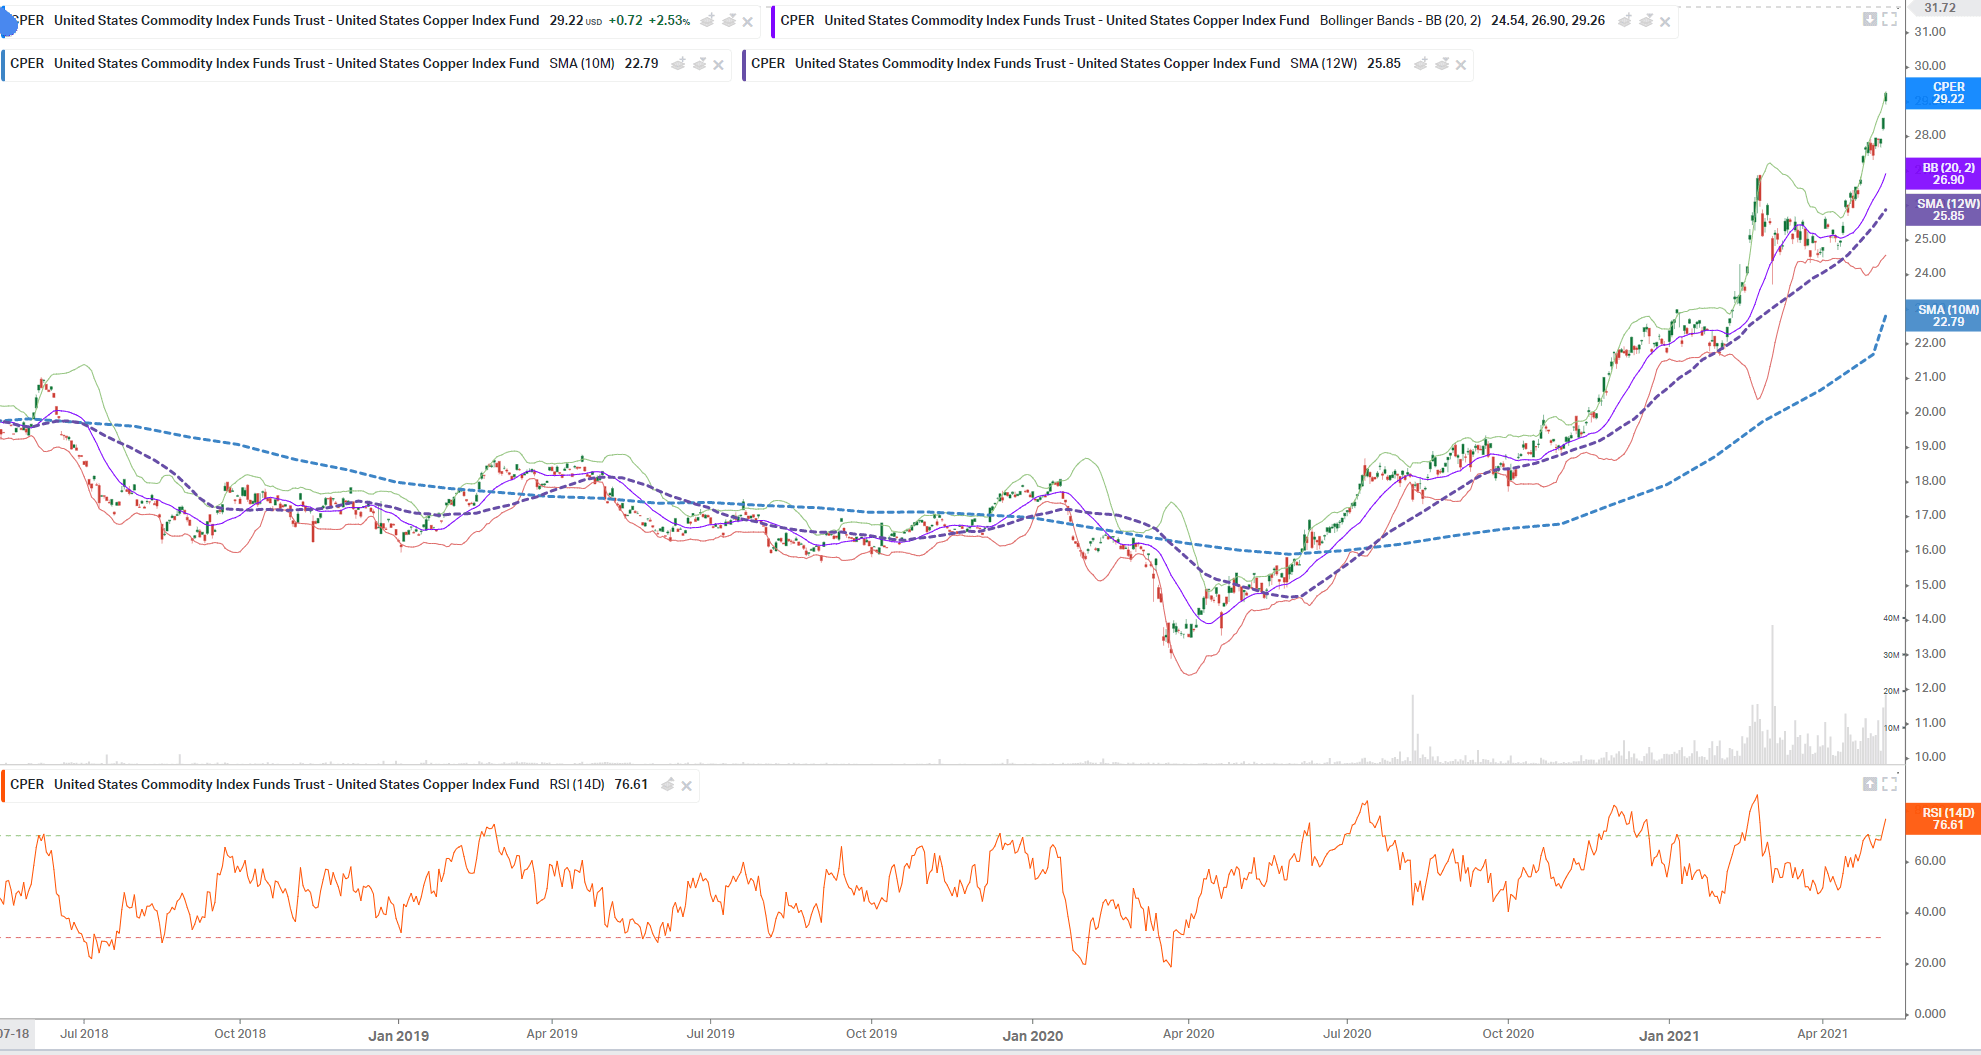
This is the price movement of the CPER a United States exchange listed ETF which is a simple way to give investors an exposure to copper futures.
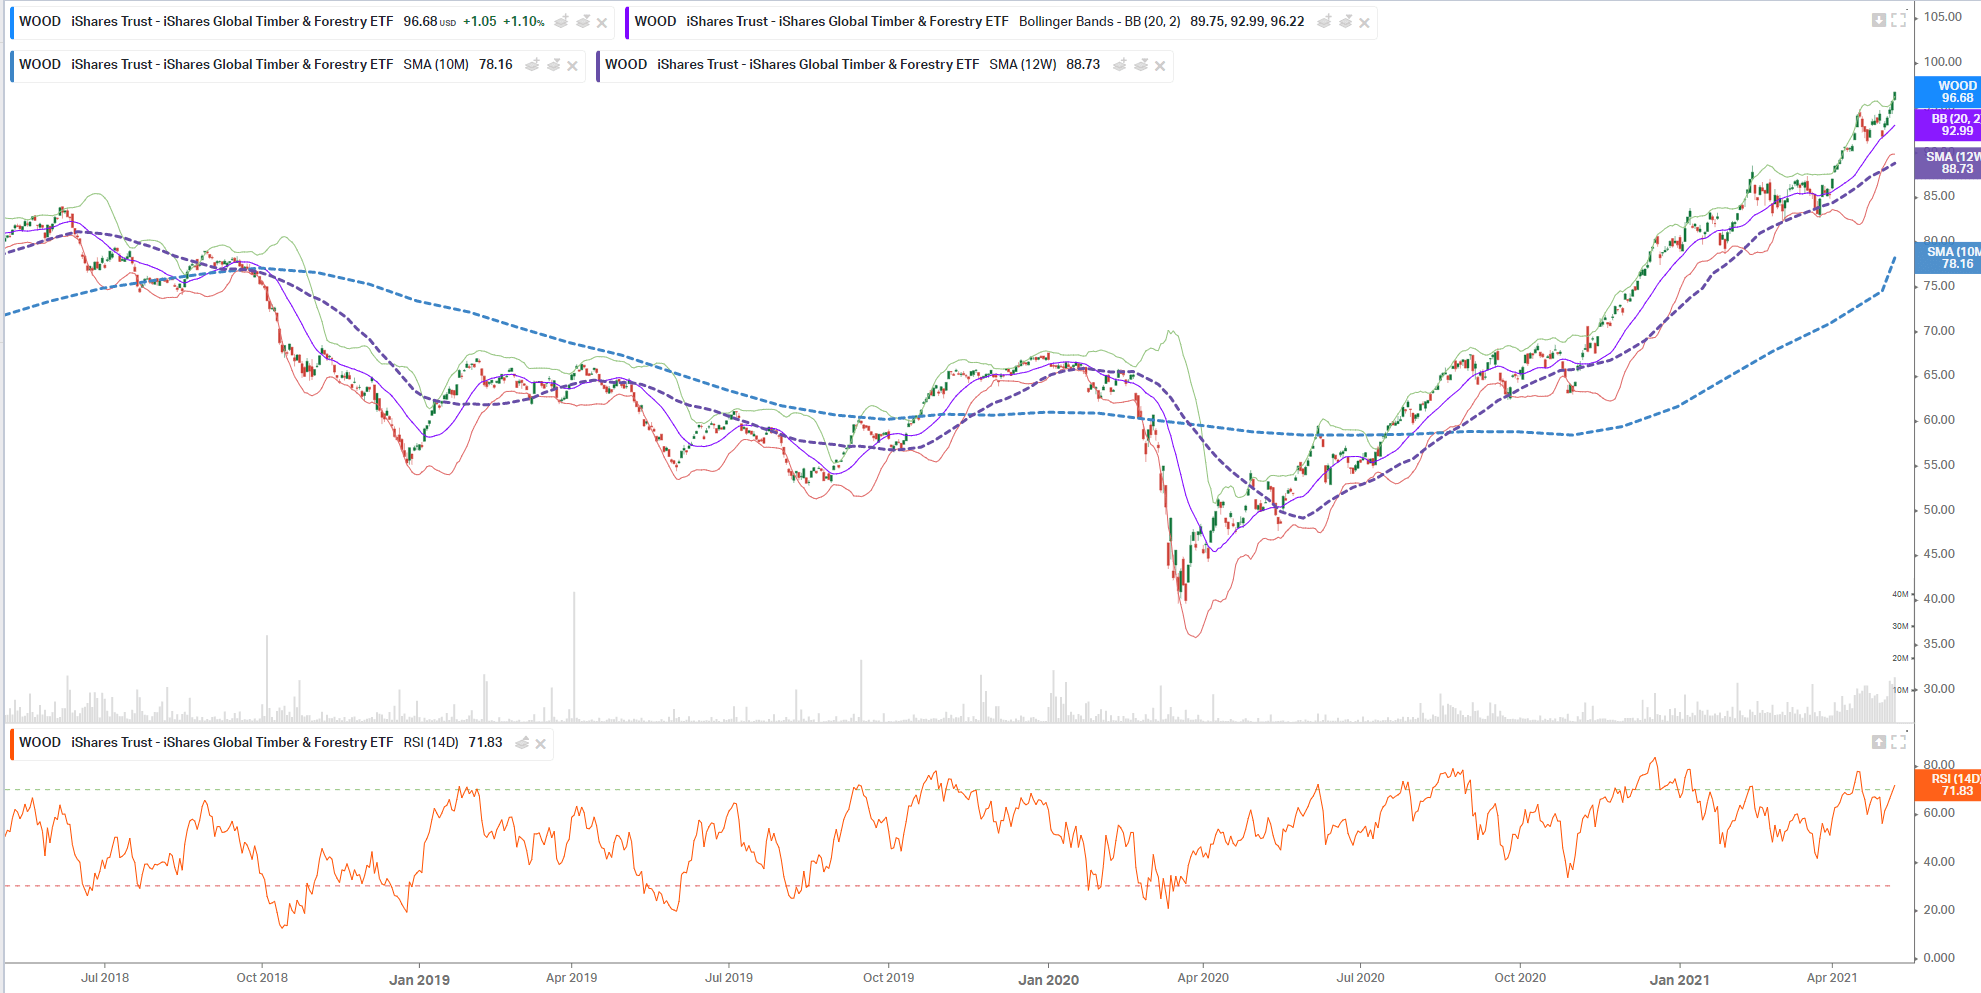
This is WOOD, the US or UCITS London Stock Exchanged listed ETF that allows you to gain exposure to a bunch of companies dealing with wood.
Both these charts probably don’t do justice to the level of price increases.
However, if you would wish to speculate on their price movement, this is a simple way to do that.
Commodities tend to be cyclical in that they go through this demand and supply swings.
It either starts with not enough production or the mining of certain commodities or materials. When supply is less than demand and the demand ramps up, prices start shooting.
When prices shoot up, more production is recruited or more firms get into it. Then the demand moderated down because the supply eventually meets the demand.
But the supply keeps coming online, resulting in oversupply and price going down. This kills some of the producers, and there is some industry consolidation.
And the cycle starts all over agian.
In this article, we try to explore different inflation data points that I came across that is interesting enough.
Growth Stock Valuation relation to Yields and Inflation
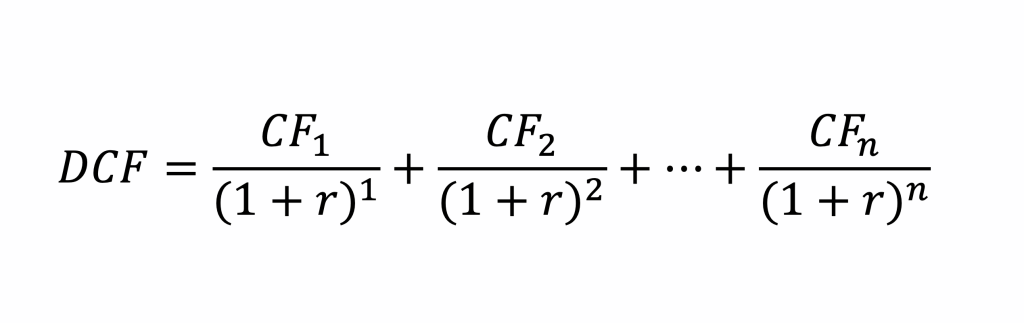
The formula above is the discounted cash flow model (DCF). It is a fundamental way of computing what a company is worth.
It does work in real life but I moved away from it because it takes time to calculate, and I find in real life, companies are rather dynamic that the nature of their cash flow, operations can shift so fast that DCF is a cumbersome way for me to roughly determine the valuation of the company.
But it still explains a lot of things. The value of a company is the aggregate of its cash flow (CF). We have to “discount” it to today’s value because $1 in the future is worth less than today.
How much less will depend on the required rate of return or discount rate (r). r is also the cost of capital, or how much an investor is willing to part ways today to risk their money in this company.
When the interest rate is moderate, say 4%, the required return for me to part my money to invest in this risky company is 10% for example. Now interest rate is 1%. I would be willing to invest in a company with the same risk at a lower r. This could be closer to 6%.
Since r is the denominator, a smaller r means the DCF or value of the company computed is higher.
Growth stocks can be valued at a higher price when interest rates are low.
Now that the long term risk-free rate goes buck higher, all else being equal, the value of the company should be lower.
This is because majority of their cash flow is not seen today but far into the future. Applying this formula for those far into the future cash flow will mean the present value is much less.
The value stocks do not have this problem because their cash flows are visible at least for the first few years. They are discounted less.
Thus, the growth companies can be likened to long-duration corporate bonds and the value companies are liken to shorter duration corporate bonds.
When interest rates go up, bond prices go down. The long duration bond prices go down more than the short duration one.
So you see this effect.
I believe in real life, things are not so theoretical. We must not forget that the numerator of that equation can surprise on the upside.
Analyst and ourselves can underestimate the potential of great companies.
It is also true that it cannot be the case that there are so many great companies that we expect to last for a long time.
There is a startling stat that the average age of companies are getting shorter and shorter.
So what are the chances of us finding so many great businesses? It is likely there will be a fair share of businesses we are overestimating their longevity and how great they are.
Which Inflation Environment Would Hurt Bond and Equity Total Returns?
Charlie Bilello at Compound Advisers did some tough number crunching to help us figure out how well bond and equity did in different levels of inflation.
Our brain tends to default to two modes no inflation and high inflation. Actually, there can be a range. We know that. But our brains often get short circuit.

Charlie broke apart the annualize return of S&P 500 based on the corresponding inflation range. There are 5 quintile where 1 is very low inflation to deflationary and 5 to be very high inflation.
You would observe that returns for quintile 2 to 4 was pretty ok. the % of years positive is also pretty high.
When things are deflationary, equities are still pretty ok but the percentage of positive return is much mixed.
Things start breaking down when inflation runs rampant.
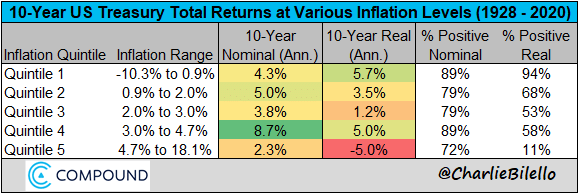
Charlie did the same for 10-year government bonds. The lowest 10-year government bond returns occur when inflation are the highest (no surprises there).
Bond returns looked good in quintile 1 and 4, which indicates bond do well when things are deflationary and moderate inflation.
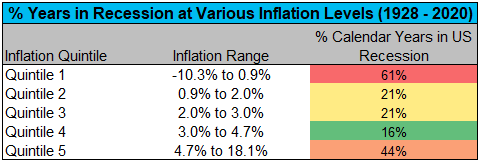

Finally, there is higher odds of US recession when things are delfationary and inflation is high.
Charlie has a good interpretation of what this means for us. The CPI in the US is up by 2.6% for the past year which puts us in quintile 3, which is generally pretty good for equities and not so good for bonds.
However, it is where we are moving to.
Many are afraid of the 1970s-like high inflation scenario. whether we get therre or not is a progression. If we get there, we know that things will get challenging.
We also have to keep in mind that these are 1-year returns.
We would often imagine that these high inflation periods to stay for 10 years, 20 years, 30 years. Most likely, this might not be the case.
Jeremy Siegal a year ago highlighted the possibility we see one major 10-15% a year spike but plateau there for a while.
Not sure whether that will happen or not but it is a possibility.
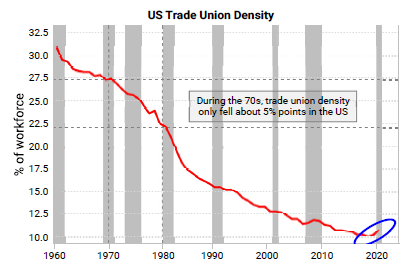
Trade Unions and Inflation
One observation is that what sustained a 1970s high inflation situation was that the wages are rising as well.
This means you are earning more (which may be good news for you!) but perhaps that earnings is inadquate to pay for your food, clothes and home.
Some economists say that such a scenarios is less likely because the employee power was higher back then due to strong unions.
Today, that has been weaker.
Variant Perception stated that the US data indicates that higher wage growth is likely as employers pay up for better quality labour in the wake of the pandemic.
We have started to hear of Google and Amazon employees trying to form unions and this may be indicative that union power is on the rise.
It is still early days yet, but we are seeing a few ingredients that there are forces conducive for inflation to go higher.
I invested in a diversified portfolio of exchange-traded funds (ETF) and stocks listed in the US, Hong Kong and London.
My preferred broker to trade and custodize my investments is Interactive Brokers. Interactive Brokers allow you to trade in the US, UK, Europe, Singapore, Hong Kong and many other markets. Options as well. There are no minimum monthly charges, very low forex fees for currency exchange, very low commissions for various markets.
To find out more visit Interactive Brokers today.
Join the Investment Moats Telegram channel here. I will share the materials, research, investment data, deals that I come across that enable me to run Investment Moats.


Do Like Me on Facebook. I share some tidbits that are not on the blog post there often. You can also choose to subscribe to my content via the email below.
I break down my resources according to these topics:
- Building Your Wealth Foundation – If you know and apply these simple financial concepts, your long term wealth should be pretty well managed. Find out what they are
- Active Investing – For active stock investors. My deeper thoughts from my stock investing experience
- Learning about REITs – My Free “Course” on REIT Investing for Beginners and Seasoned Investors
- Dividend Stock Tracker – Track all the common 4-10% yielding dividend stocks in SG
- Free Stock Portfolio Tracking Google Sheets that many love
- Retirement Planning, Financial Independence and Spending down money – My deep dive into how much you need to achieve these, and the different ways you can be financially free
- Providend – Where I used to work doing research. Fee-Only Advisory. No Commissions. Financial Independence Advisers and Retirement Specialists. No charge for the first meeting to understand how it works
- Havend – Where I currently work. We wish to deliver commission-based insurance advice in a better way.
Kyith is the Owner and Sole Writer behind Investment Moats. Readers tune in to Investment Moats to learn and build stronger, firmer wealth foundations, how to have a Passive investment strategy, know more about investing in REITs and the nuts and bolts of Active Investing.
Readers also follow Kyith to learn how to plan well for Financial Security and Financial Independence.
Kyith worked as an IT operations engineer from 2004 to 2019. Currently, he works as a Senior Solutions Specialist in Insurance Start-up Havend. All opinions on Investment Moats are his own and does not represent the views of Providend.
You can view Kyith's current portfolio here, which uses his Free Google Stock Portfolio Tracker.
His investment broker of choice is Interactive Brokers, which allows him to invest in securities from different exchanges all over the world, at very low commission rates, without custodian fees, near spot currency rates.
You can read more about Kyith here.
- New 6-Month Singapore T-Bill Yield in Late-April 2024 to Drop to 3.70% (for the Singaporean Savers) - April 18, 2024
- Golden Nuggets from JPMorgan Guide to Retirement 2024. - April 16, 2024
- Be Less Reliant on Banks and Build Stronger Capital Markets by Pushing for Better Shareholder Dividend and Buyback Yield - April 14, 2024