Personal finance books would usually teach us how to tell whether we are in a good or poor financial position.
Today, we continue with our Family Inc Series with a look at what Doug McComick recommends as metrics to measure the health of our family wealth.
You could use these metrics for a snapshot of how your family is doing. You could incorporate them into your tracking as well.
I take particular interest in this chapter to see if there are metrics that we can incorporate into my firm’s financial planning practices. You gotta keep trying to do better.
It is important for you to have an idea about your income and net wealth. And having personal income and balance sheet statements are a way to know how well you do.
We take a look at what Doug thinks we should take note of.
The Income Statement
In a financial statement, the income statement shows the readers the profit that the company or group of company earn in a year.
On a personal basis, your income statement would show your money inflows and outflows. Usually in a company’s income statement there is a separate cash flow statement. However, on a personal level an income statement or a cash flow statement is good enough.
Investment Moats recommends creating your personal cash flow statement.
Income (or Revenue) Concentration
The concentration shows the mix among the sources of income. It shows how evenly split are the two spouses’ income.
I used to have this thinking in my brain that if my friend makes $60,000 a year, her spouse also make $60,000 a year. Turns out, after more observation, for some reason the income mix is always not proportionate.
This ratio can be 50% if it is evenly split.
If you make $60,000 a year and she makes $40,000 a year, then its 60:40.
The idea of this ratio is probably more to keep in mind if your family allocates their budget according to how much each brings in.
It is also for your family to consider if you are taking up mortgage loans for example.
Surplus (Savings) Margin
Readers should be familiar with this one.
Surplus Margin = Cash Surplus / Revenue
Cash surplus is how much savings you have after satisfying all your expenses.
Doug says this is the most important metric in the page because it shows how efficiently you are able to turn labor assets into capital.
The faster you save, the faster you expand the investments in your asset management business.
The surplus margin also measure how much buffer you have, against contingencies that is inherent in you Family Inc.
A family that has a 25% surplus margin can experience a 25% decrease in income and still maintain consumption. A family with a 10% surplus margin, by contrast, would have to cut the expenses by 15%.
Does that mean that…. if my surplus margin is…. 50%, If I lost my job, I can survive for 1 year?
That is powerful indeed.
Fixed Expenses, Semi-Fixed Expenses and Variable Cost Margins
Doug explains that in the business context, this is the order of preference (top being most preferred):
- Variable costs
- Semi-fixed costs
- Fixed costs
The more fixed costs you have, as a percentage of your total costs, the less flexibility you have.
Doug says, if 80% of your costs are fixed, it would be impossible over the short term to reduce your consumption. That is, to reduce enough to accommodate a 25% decrease in income.
With variable costs, you can adjust quickly.
I tend to not like these terms over the years because it can be confusing. However, I absolutely get Doug’s grouping.
As an example, is your food, transport and home fixed costs, variable costs? These are technically variable but you cannot live without it. So likely these are the semi-fixed costs.
The fixed costs would be the taxes, on going medical costs, household maintenance… but even these, I can see you having a debate with me.
However, the reason for the margins is real:
If almost all your costs are fixed, then you have no flexibility. When it comes to planning for your financially independence, you need a concrete large sum as well.
Fixed plus Semi Fixed Charge Coverage Ratio
This is a comparison of your after-tax income versus (fixed + semi-fixed expenses).
The higher this ratio the greater your financial security.
Doug says if this ratio of yours is less than 1.25 times, the family is exposed to excessive risk of financial distresses.
I think this is something like the top ratio. I could invert it and it shows the ratio of income to fixed expenses.
It basically wishes your fixed expenses is small versus your income. High savings ratio usually keeps this ratio in check. If you own less stuff, your ratio might be lesser as well.
The Balance Sheet
The balance sheet, or net worth, or net wealth, or equity are referring to the same thing.
It shows your total assets, your total liabilities.
When you deduct the total liabilities from total assets, you will get total net worth/ net wealth/ equity.
You can read my personal net worth statement article here.
In this section, Doug highlights a few key measures of wealth.
- Family Inc Net Worth. This is total assets minus total liabilities
- This is broad
- Includes you and your spouse or (children that are not married?) expected after-tax future labor
- Includes your government pension value such as CPF
- Financial Net Worth. This is your total financial assets minus total liabilities
- Excludes Labor
- Excludes Government pension value
- Financial Earning Net Worth. This is financial net worth excluding the following:
- Assets or durable purchases that lose value, or depreciate, with normal age and use
- E.g. cars, trucks, appliances, electronics and furniture
- Investment Assets. This is the sum of all financial assets other than depreciating assets. This keep track of productive assets your business has working for you at any time
Why so much different measures?
I get this question a lot. Do you include your home? Do you include your CPF? There is a need to have these differentiation firstly to let you know what are accounting for.
The Family Inc Net Worth is likely for you to see the importance of your labor when you are starting out. When you start out, you do not have anything. However, the life time value of your labor has a substantial value. In contrast, for a person that is 56 years old, his labor value would have been less.
Financial Net Worth or Financial Earning Net Worth is closer to what we use in our financial independence planning. It eliminates the establishment risk that is of the government and also labor tends to be intangible. You have to accumulate investment assets in order for it to be tangible for some concrete planning.
Knowing how much investment assets you have is more relevant to keep track of how they are performing.
The Importance of Your Asset Composition
Doug provides some real Kung Fu here when he emphasize this: You need to take a hard look at what your assets are composed of all the time.
- Your labor assets will eventually be less useful over time
- It will be converted to other assets
- Different assets have different long term rate of return. For example, properties have a rate of return of 2 to 3%. Equities 5%. Your depreciating assets have a rate of return of -10%
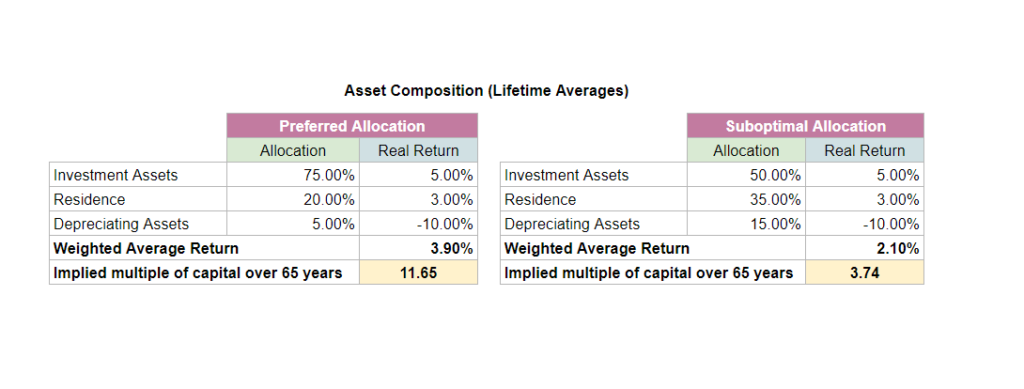

If you have allocated your assets well, exchanging it for productive capital assets, your wealth should grow well.
If it is sub-optimal, you would need to look into it.
Your Liquid Accounts
Liquid accounts that you will own will include
- checking
- cash equivalents
- short-term fixed income
These accounts provide your daily cash flow needs and as a safe store of value.
Months’ Contingency Capital
Months’ Contingency Capital = Liquid Accounts / Monthly Expenses
If you are unemployed tomorrow with no income, this ratio will tell the number of months your liquid assets could support your current rate of consumption.
This is basically like your emergency fund. And Doug recommends maintaining 3 months.
In this financial independence community, there are the crazy folks that would have 120 months for this!
Borrowing Capacity
This represents the max you could borrow from various sources of credit (mainly a home equity line of credit and credit cards) after deducting any outstanding balances.
In Singapore context, some sources would be personal loans and borrowing on the value of your cash value life insurance policies.
These stuff… if you are less sophisticated is like a ticking bomb. For those who know what to do with them, this can be used to blow up and sculpt a work of art.
The reason to assess this is because this also serve as contingency funds.
Months’ Borrowing Capacity
Months’ Borrowing Capacity = Amount you can borrow / Monthly Expenses
This is a variation of Month’s contingency capital.
This basically expanded your emergency fund by almost double or triple the base amount.
You do not need to draw down on it. However, if you absolutely have to, this is available.
Net Debt
Net Debt = Total Debt – Liquid Accounts
This is a refined measure of how leveraged you are.
It is what I used when assessing business as well. In the event that you are forced into a tight spot, the debt that you are worried about would be the amount you need to pay off.
For some, you can have $400,000 in debt but have $400,000 in liquid accounts, your situation is not too bad.
Net Debt to After-Tax Earnings and Net Debt to Investment Assets
There are 2 ratios here.
The first one is
Net Debt to After-Tax Earnings = Net Debt / After-Tax Earnings
This will show you how much of your income can be used to service the debt before consumption.
This is particularly sensitive to life cycles.
A young family may incur significant amount of debts to finance a home and education. When you measure it against their increasing earnings, you can assess whether these costs that you have spent are worth it.
Net Debt to Investment Assets = Net Debt / Investment Assets
By right, we should not have more debt than our investment assets. You would have more debt than investment assets, if the mortgage is on your primary residence. That is not counted as an investment assets. So this will make your ratio look….
I think if you hold a lot of investment assets, it can also show your ability to sell off the investment assets to repay the debt.
Doug recommends a net debt to after-tax earnings to be less than 6 times. I think this is not too conservative but good enough. Usually, I would use 5.
Doug recommends a net debt to investment assets to be below 1.
If you bought a primary residence with debt, your net debt to after tax earnings will be high. If it is an investment property, this ratio will go down because the rental income is part of earnings.
If your debt is consumption related, the net debt to investment assets will be high. That is not a good thing.
Liability Composition
This section will be rather short. Doug provided some advice on how he would look at debt.
- Maximize real estate loans over all other debt. Mortgage loans provide a sweet spot between low cost, long maturity and tax deductibility
- Finance significant purchases such as automobiles and education with available loans as long as the rates are less than 6%. Doug explained that these debts are attractive because of government funding for education and lenders for autos have recourse to the assets (they repossess the car if you do not pay)
- Compare between fixed rates and variable rates. There are no rule of thumb here. It depends on what you want
- Use credit cards as a loan of last resort
- Include your home equity line of credit as a potential source of cash to support your contingency planning program
The general idea is Doug is in favor of using leverage, but it has to be controlled and monitored. If you read this article in full, you will realize he has some monitors in place such as
- Months’ contingency capital
- Months’ borrowing capacity
- Net Debt to After-Tax Income
- Net Debt to Investments
- Asset Composition
- Fixed and Semi-Fixed Ratio to Total Cost
Conclusion
There are a few that I have not encounter before. I appreciate this book for sharing them. This book could go into this discussion because the readers tend to be more advanced.
Doug’s breakdown of the measure of wealth is good.
If you are doing your net worth tracking spreadsheet, those will be some categories to track over time. Most of my metrics look tip top but that is because my situation is a bit different.
How did your metrics look?
Family Inc is a Good Book. You can pick them up in your book store or the library.
My Family Inc Series of Articles are:
- Viewing Your Career as Investments
- 8 Weaknesses of Conventional Family Asset Allocation
- Measures of Family Wealth
I invested in a diversified portfolio of exchange-traded funds (ETF) and stocks listed in the US, Hong Kong and London.
My preferred broker to trade and custodize my investments is Interactive Brokers. Interactive Brokers allow you to trade in the US, UK, Europe, Singapore, Hong Kong and many other markets. Options as well. There are no minimum monthly charges, very low forex fees for currency exchange, very low commissions for various markets.
To find out more visit Interactive Brokers today.
Join the Investment Moats Telegram channel here. I will share the materials, research, investment data, deals that I come across that enable me to run Investment Moats.


Do Like Me on Facebook. I share some tidbits that are not on the blog post there often. You can also choose to subscribe to my content via the email below.
I break down my resources according to these topics:
- Building Your Wealth Foundation – If you know and apply these simple financial concepts, your long term wealth should be pretty well managed. Find out what they are
- Active Investing – For active stock investors. My deeper thoughts from my stock investing experience
- Learning about REITs – My Free “Course” on REIT Investing for Beginners and Seasoned Investors
- Dividend Stock Tracker – Track all the common 4-10% yielding dividend stocks in SG
- Free Stock Portfolio Tracking Google Sheets that many love
- Retirement Planning, Financial Independence and Spending down money – My deep dive into how much you need to achieve these, and the different ways you can be financially free
- Providend – Where I used to work doing research. Fee-Only Advisory. No Commissions. Financial Independence Advisers and Retirement Specialists. No charge for the first meeting to understand how it works
- Havend – Where I currently work. We wish to deliver commission-based insurance advice in a better way.
Kyith is the Owner and Sole Writer behind Investment Moats. Readers tune in to Investment Moats to learn and build stronger, firmer wealth foundations, how to have a Passive investment strategy, know more about investing in REITs and the nuts and bolts of Active Investing.
Readers also follow Kyith to learn how to plan well for Financial Security and Financial Independence.
Kyith worked as an IT operations engineer from 2004 to 2019. Currently, he works as a Senior Solutions Specialist in Insurance Start-up Havend. All opinions on Investment Moats are his own and does not represent the views of Providend.
You can view Kyith's current portfolio here, which uses his Free Google Stock Portfolio Tracker.
His investment broker of choice is Interactive Brokers, which allows him to invest in securities from different exchanges all over the world, at very low commission rates, without custodian fees, near spot currency rates.
You can read more about Kyith here.
- My Dividend Experience Investing in UCITS iShares iBond Maturing in 2028. - April 23, 2024
- We Invest into Popular Funds When They Are Popular, Exactly When They Started Turning to Shxt. - April 22, 2024
- Meal Prep 2.0 – Cooking Your “Go-to” Meal that You Look Forward to Eating Everyday. - April 21, 2024
Bob
Sunday 28th of July 2019
Hi,
Does that mean that…. if my surplus margin is…. 50%, If I lost my job, I can survive for 1 year?
If I understood correctly, then no, because income goes to zero and the survival time depends on the amount of savings and income derived from them?
Kyith
Thursday 1st of August 2019
not really. suppose year 0 you make 30,000, and you spend 15,000. the rest you save. after one year, you loss your job. technically you can survive for 1 year.