This week, I ran out of ideas for any good post, or that I was too tired from work to do much long form posts.
Here are some of the best bits that captured my attention this week.
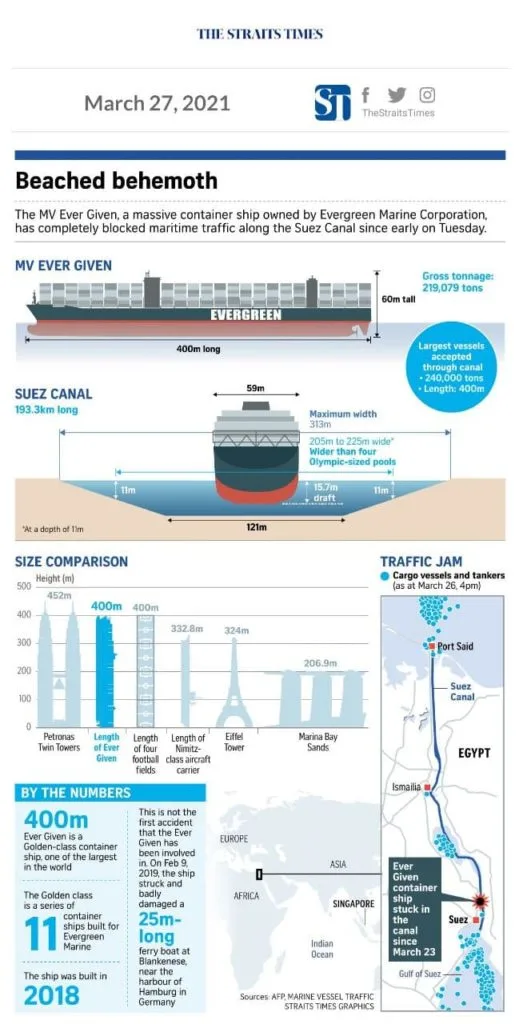
Lessons from the Suez Canal Ever Given Blockage


By now, you might have heard that a ship, almost the length of the Empire State Building is blocking the Suez Canal. By the the looks of things, it will not be unstuck so fast.
And it is disrupting global trade. Supply and demand will be out of wack and we are not sure if there will be some level of inflation.
The Suez Canal is quite interesting in a lot of ways. You can read up its history on Wikipedia. It was built in the 1850s to 1860s and it took 10 long years of forced labour to dug it out.
It is a marvel what could be achieved with less technology.
I am sure the Suez Canal was more important to global trade last time. Perhaps our lower dependence on it is a sign of progress.

My main lesson here is that sometimes shit will happen even if you plan really well. Dunno how many freaking numbers of ships passed by the Canal and just so happen a strong gust of wind fxxks up this ship.
The folks at the Suez Canal also expanded the Canal to two channels to increase the capacity. But the Ever Given got stuck at the place where only one channel were permissable.
In life, you can plan well but shit happens. While this was disruptive, from the link in the article above, other ships will have to take alternative routes to get to their destination.
We are in the investment and wealth advisory business. Prospects come to us looking for greater certainty. I can tell you based on past returns, this kind of portfolio gives you the greatest reliability of achieving your goals.
But there is no absolute guarantee and this is a nice analogy.
We can tell you that there are a few pitfalls that could derail you but in truth, there are some scenarios that both of us would not come to mind.
It is always important to know how to adjust your plan in a sound manner to still get to your goals, or be in a better personal situation.
Lastly, what saved a lot of plans was enough sound buffers. Sound buffers can mean a lot of things: Well thought out extra sum of budget, multiple sources of suppliers, a large network of peers to depend upon, lower expectations versus reality.
If Your Fund Did 100% This Year What Can You Expect in Subsequent Years?
I think I have written something on the subject of star fund managers recently and this one looks at things in a different flavour.
Jeff Ptak over at Morningstar did a study of how funds that performed very well in the past did a few years later.
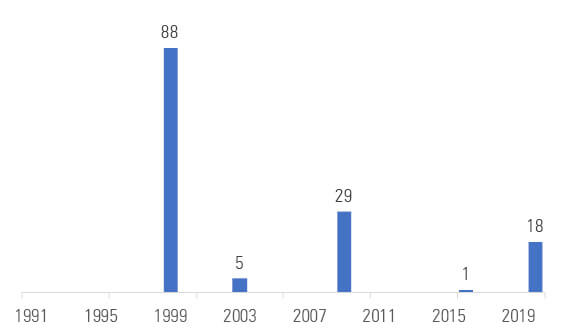
(as of Dec. 31, 2020; includes dead funds; oldest share class only)
Actually you look at this, its very uncommon to have 100% return in a fund! They tend to cluster into a few time periods (DotCom… maybe after 1998, recovering from the 2000 to 2002 period, after the GFC and recently.)
Which makes me wonder, baring any big events, would funds still do more than 100% a year?
(as of Dec. 31, 2020; includes dead funds; oldest share class only)
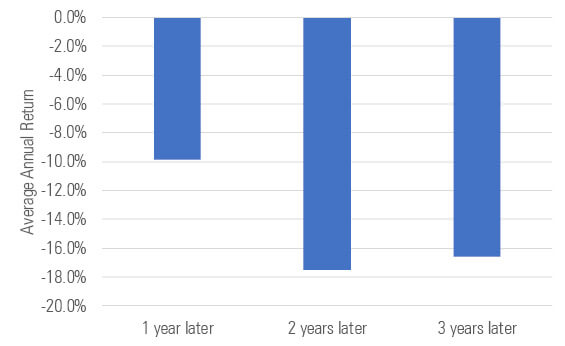
Imagine if you see a fund return 100%… and then you decide to get into the fund. We might be doing this now.
On average, the fund returns were pretty bad all round.

(Jan. 1, 1991-Dec. 31, 2020; includes dead funds; oldest share class only)
If we count the funds who were positive versus negative after a year where they did very well, on average you have more funds doing poorly than they are being positive.
(as of Dec. 31, 2020; includes dead funds; oldest share class only)
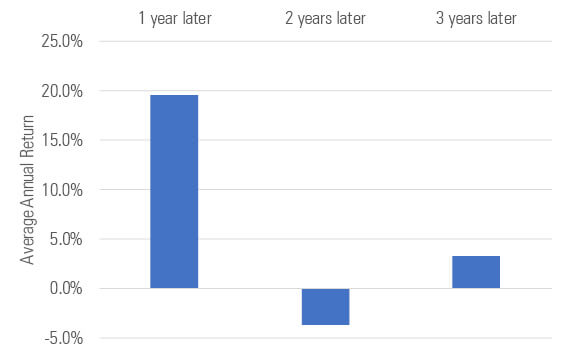
Jeff tried to do some data mining by trying to exclude the funds that did well during 1999. He finds that the funds in 1999 were narrower.
If we qualify the recent good performers, we find that 18 of the funds that did 100% can be assigned narrow or wide moat rating. This means they have some sort of advantages.
The chart above shows how the funds did if we exclude the 1999. On average the average return after 1 year was good but then it start tapering off after.
The market conditions definitely factor into the result. However, if you have done 100% in a year, your investors were expecting magic from you, despite whatever market conditions there are.
(as of Dec. 31, 2020; includes dead funds; oldest share class only)
We would think that by analyzing how well funds did in the past, we will be able to find the funds that does well in the future.
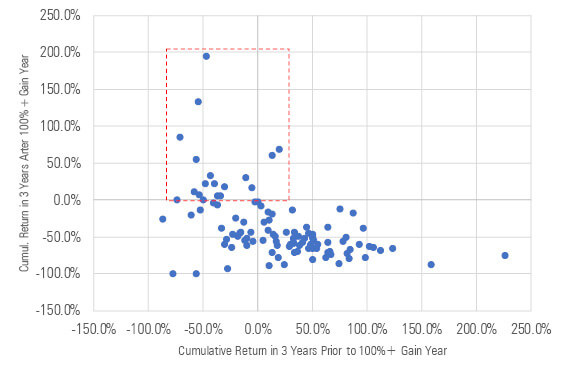
- Funds that did 100% in the year, but had losses the year before, saw 11% cumulative losses the years after.
- Funds that made money before the 100% year lost 52% of their value in the subsequent three years. This is important because 17 of the 18 funds that gained 100% or more in 2020 had produced positive returns in the three prior years.
One of our client advisers raised a good point: If there is a clear relationship between past performance and future returns, we should see this chart sloping from bottom left to top right. That do not seem to be the case.
The great funds have some work to do to disprove this.
Ultimately, I would also like to say…. the funds could subsequently lose money for 2 years before doing well for the past 10 years if we look bad.
If you wish to outpeform, you cannot mirror the index. You need to take a direction and that means some underperformance here and there.
The Bull Markets in a Secular Bear
Michael Batnick has a post looking at the recent rapid drawdowns in the smaller growth companies that did well.
There were some interesting take-aways.
Volatility can be tough to swallow.
When a stock
- keeps going up and up
- up and pause than up
- stays the same
It gives you the feeling that the stock is not very volatile. I think REIT investors felt that way as well.
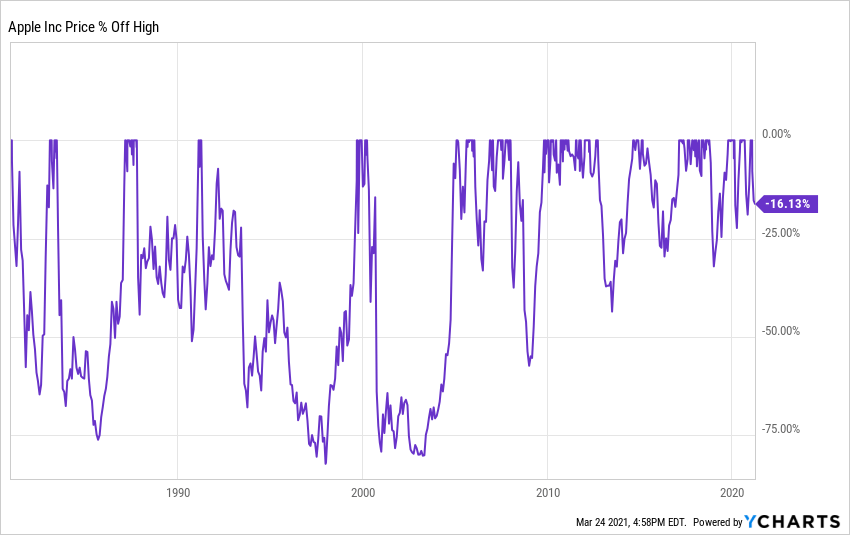
Michael posted a chart showing the historical drawdown of Apple. We know now that Apple is one of the blue chip in the world.
You can also see the progression to that status.
There were enough instances where Apple went down by more than 75%.
Even in recent years, Apple stock price went down by more than 20%.
There is a reason stocks command a higher return than bonds and its because we take on a different risk as shareholders as compared to being creditors.
In a way, I felt that a lot of people (course conductors, bloggers, friends) gave advise that misses out on alot of these nuances. Comments were made more on the outlook on returns and less on the size their friends/students/readers invest in and their risk profile. These are boring stuff but in a way… they do matter.

The chart above shows the excess lifetime returns on the individual stocks in Russell 3000 for the 40 year period between 1980 to 2020.
Russell 3000 basically represents the biggest 1000 and smallest 2000 companies in the United States. It basically includes all the company.
While it is not plotted here… From Koyfin, the returns from 1978 to 2019 was 11.7% a year. Pretty good. If I leave out dividends, it is 8.83% a year.
Lifetime excess returns mean for each stock in Russell 3000, they tally the excess return above 11.7% in the chart above. So if a stock did 10% a year, it is a negative 1.7% excess return.
This chart basically showed that on average, more than 50% of the Russell 3000 stocks did worse than the average on a long term basis.
If you invest in a sub-basket of stocks, tis a high chance you would do worse than holding an entire basket of Russell 3000.
The returns of the entire index is determined by a small number of stocks that did very well.
If you are an active stock picker, you got to make sure you pick these stocks and have less of those on the left side.
This is why… investing in the index is sometimes not about diversifying the risk but capturing the returns of the top performers.
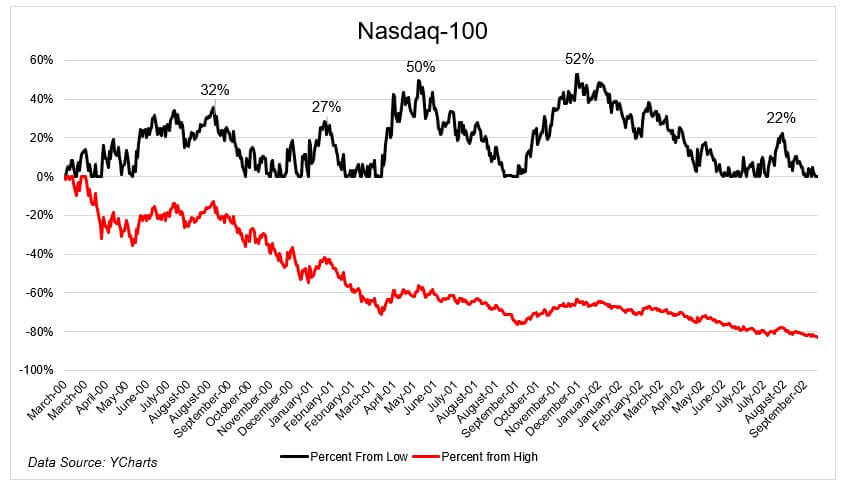
The chart above shows the demise of the Nasdaq 100 from March 2000 to September 2002.
Many commentators were wondering whether this 3 years is similar to that period.
That is not always the important thing. Michael showed the number of counter-rallies within 80% fall.
Things do not go down in a straight-line.
There was enough rally that made you question whether things have turned the corner. And of course, there is money to be made.
Reading about the demise is one thing. Investing through this period is another thing.
I think enough people believed that owning Cisco, Amazon, Oracle and Microsoft was “the right move” going forward. Those counter-rallies would have validated that.
Readers like to ask “When do you think the market will turn or what is the outlook going forward?”
May be the question to ask is how long is the draw down, how many counter-rallies inside the draw-down and roughly the magnitude of the counter-rallies.
KNN I am glad I don’t have to answer those questions.
I invested in a diversified portfolio of exchange-traded funds (ETF) and stocks listed in the US, Hong Kong and London.
My preferred broker to trade and custodize my investments is Interactive Brokers. Interactive Brokers allow you to trade in the US, UK, Europe, Singapore, Hong Kong and many other markets. Options as well. There are no minimum monthly charges, very low forex fees for currency exchange, very low commissions for various markets.
To find out more visit Interactive Brokers today.
Join the Investment Moats Telegram channel here. I will share the materials, research, investment data, deals that I come across that enable me to run Investment Moats.


Do Like Me on Facebook. I share some tidbits that are not on the blog post there often. You can also choose to subscribe to my content via the email below.
I break down my resources according to these topics:
- Building Your Wealth Foundation – If you know and apply these simple financial concepts, your long term wealth should be pretty well managed. Find out what they are
- Active Investing – For active stock investors. My deeper thoughts from my stock investing experience
- Learning about REITs – My Free “Course” on REIT Investing for Beginners and Seasoned Investors
- Dividend Stock Tracker – Track all the common 4-10% yielding dividend stocks in SG
- Free Stock Portfolio Tracking Google Sheets that many love
- Retirement Planning, Financial Independence and Spending down money – My deep dive into how much you need to achieve these, and the different ways you can be financially free
- Providend – Where I used to work doing research. Fee-Only Advisory. No Commissions. Financial Independence Advisers and Retirement Specialists. No charge for the first meeting to understand how it works
- Havend – Where I currently work. We wish to deliver commission-based insurance advice in a better way.
Kyith is the Owner and Sole Writer behind Investment Moats. Readers tune in to Investment Moats to learn and build stronger, firmer wealth foundations, how to have a Passive investment strategy, know more about investing in REITs and the nuts and bolts of Active Investing.
Readers also follow Kyith to learn how to plan well for Financial Security and Financial Independence.
Kyith worked as an IT operations engineer from 2004 to 2019. Currently, he works as a Senior Solutions Specialist in Insurance Start-up Havend. All opinions on Investment Moats are his own and does not represent the views of Providend.
You can view Kyith's current portfolio here, which uses his Free Google Stock Portfolio Tracker.
His investment broker of choice is Interactive Brokers, which allows him to invest in securities from different exchanges all over the world, at very low commission rates, without custodian fees, near spot currency rates.
You can read more about Kyith here.
- New 6-Month Singapore T-Bill Yield in Late-April 2024 to Drop to 3.70% (for the Singaporean Savers) - April 18, 2024
- Golden Nuggets from JPMorgan Guide to Retirement 2024. - April 16, 2024
- Be Less Reliant on Banks and Build Stronger Capital Markets by Pushing for Better Shareholder Dividend and Buyback Yield - April 14, 2024