I gotta say, I have never been so poorly positioned before. And I have possibly made some really schoolboy mistakes.
But I am no guru who is selling a top list of stocks to buy with a Covid-19 contagion or top list that I will be looking to buy, so that is OK.
So I just hope everyone stays safe.
Some General Indices Data Points
I would just wish to capture some data points for blog history’s sake. I remember back in the days, my fellow blogger La Papillion from Bully the Bear used to capture these when we were bully by the bear instead.
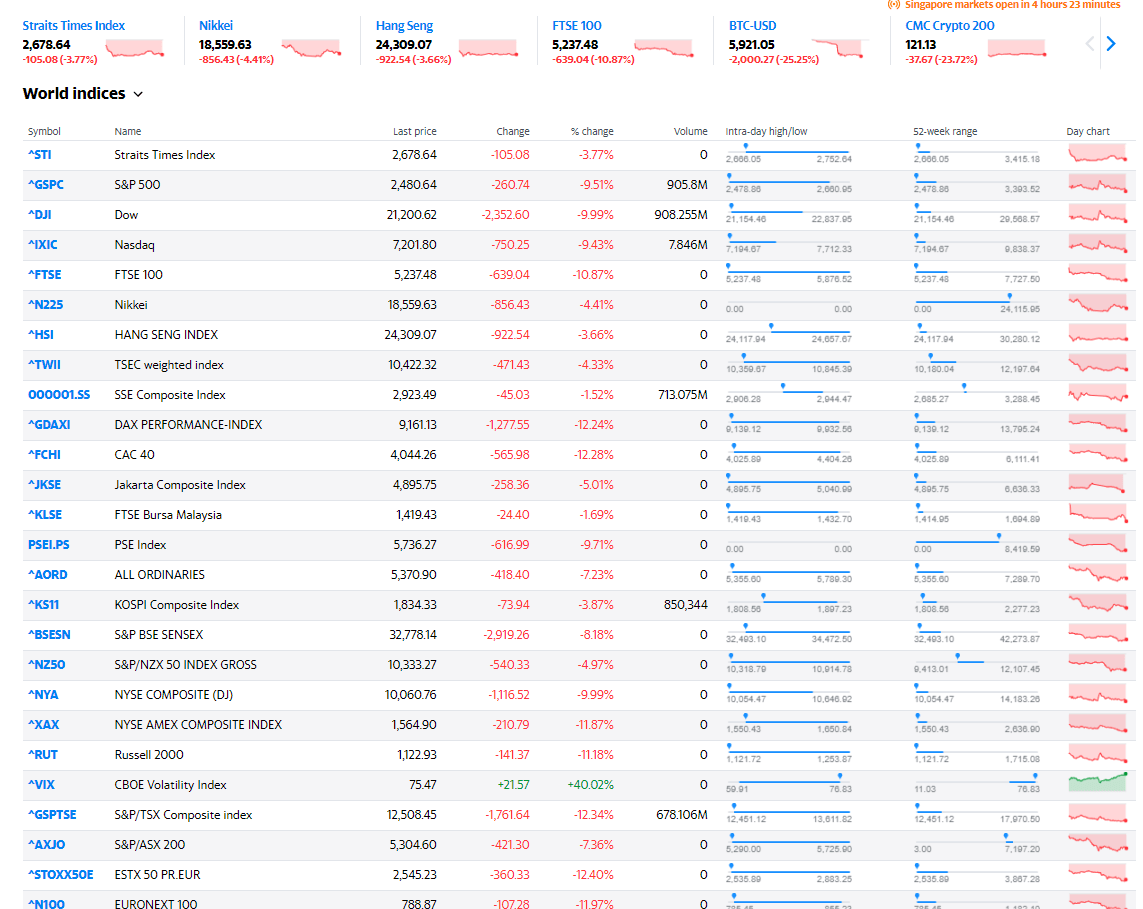
Everything is down and down by a lot. Even Bitcoin is down which is befuddling but I think it will be recovering soon with the event upcoming.
Some of the older readers would know I ran this Dividend Stock Tracker where I keep track of some high yield dividend-yielding stocks in Singapore.

The fall yesterday was crazy. Some really enticing deals out there, but not sure if there is a liquidity event on the horizon.
How Rare Are These Huge Daily Gyrations?
A lot of investors who started investing in the 2010s are not used to seeing this kind of volatility, even in the indexes.
This is new to them. Even for someone like myself who went through it, this IS a bit crazy. Even in 2008, I seldom see 9% down days on the indexes!
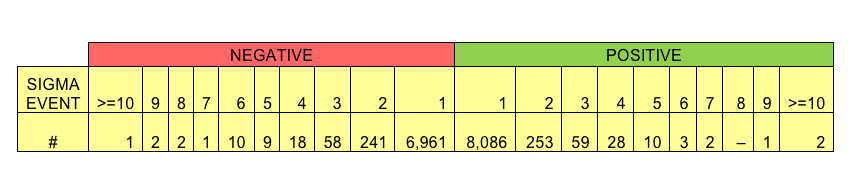
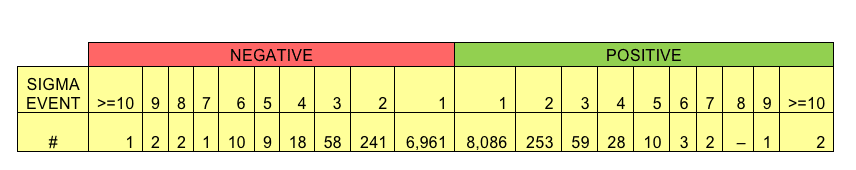
CFA Institute has a good table showing the standard deviation distribution of the SP500 from 1950 to 2012. This is interesting in that it bypasses the 1920s to 1930s which is very volatile.
The majority of the fluctuation in prices is within +1 and -1%. You get rare events like this. 3-4% is basically… a 3-4 standard deviation event already.
A 1 standard deviation means that there is a 68% chance the price movement is capture within -1% to +1%. If we invert this, there is a 32% probability that your daily return is not captured in this range.
In a 3 standard deviation event, we have a probability of 0.13% that it will not be captured in the -3% and 3% range.
How Are are These Huge Monthly Gyrations?
Thus, today’s -9.51% move in the S&P 500, this event almost should never happen. It is like a TOTO event.
We are basically nearly -25% from the highs on the index, which means that we are in bear market territory.
Going back to 1926, the average monthly return on the S&P 500 is 0.95%. The standard deviation is 5.37%.
S&P 500 hit a new high in February 2020 but closed off sharply lower. This is a rare situation.
- FEB 2020 returns: -9.4%
- Mar MTD returns: -16.28%
Feb returns are almost a 2 standard deviation event and Mar is almost 3 standard deviation. In the grand scheme of things, these are important buying days or important days to avert because it is rare.
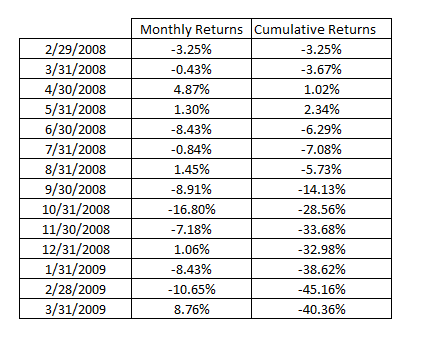
Out of what I experienced, this is the monthly returns. We can see that this drawdown looks pretty similar to the mid or tail end of a bear market.
2008’s price movement is a brutal 3.8 standard deviation event. It is a rare return.
If you were to ask me what felt different for this one was that… 2008 was a difficult event for shorting because anytime a certain stimulus package was announced, there will be huge counter-rally.
Some of those look rather tame but a lot of them look like they are going to turn. They get your hopes up high until the end where you just give up believing it.
It makes shorting pretty difficult.
This time around, whatever Trump tried to say, the market got even angrier.
I guess this is the main difference.
Past Greater than 10% Drawdowns and Returns Over Time if you stayed invested
Some data may not see the light of the day at Providend because it might unnecessarily scare the daylights out of some clients.
But here it is.
There are about 25 instances where the S&P 500 fell by more than 10% in 1 month.
I took a look at the returns if you have stayed invested.
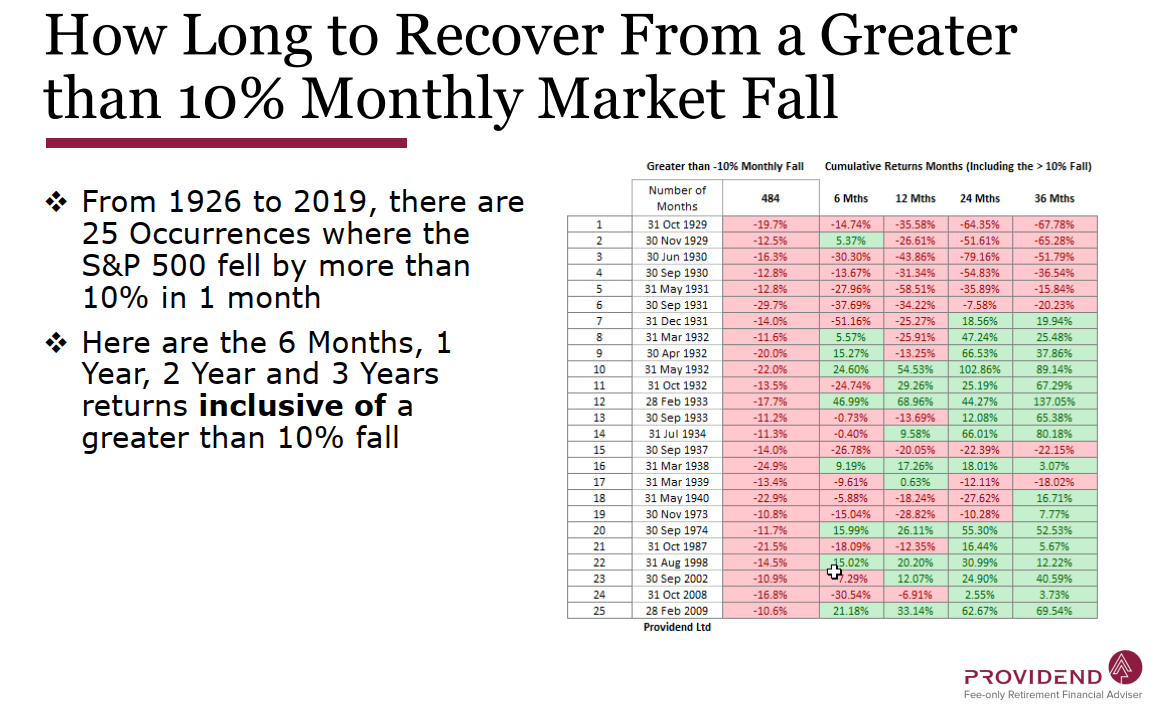
You can see how brutal the 1920s and 1930s were. There are 10 instances out of the 25 instances that the monthly return is less than 16%.
If you take out eh 1920s and 1930s, after 2 to 3 years, you would not be red anymore.
I also took a look that if we prudently be in a 60% SP500 and 40% US-Treasury, whether that helped the situation:
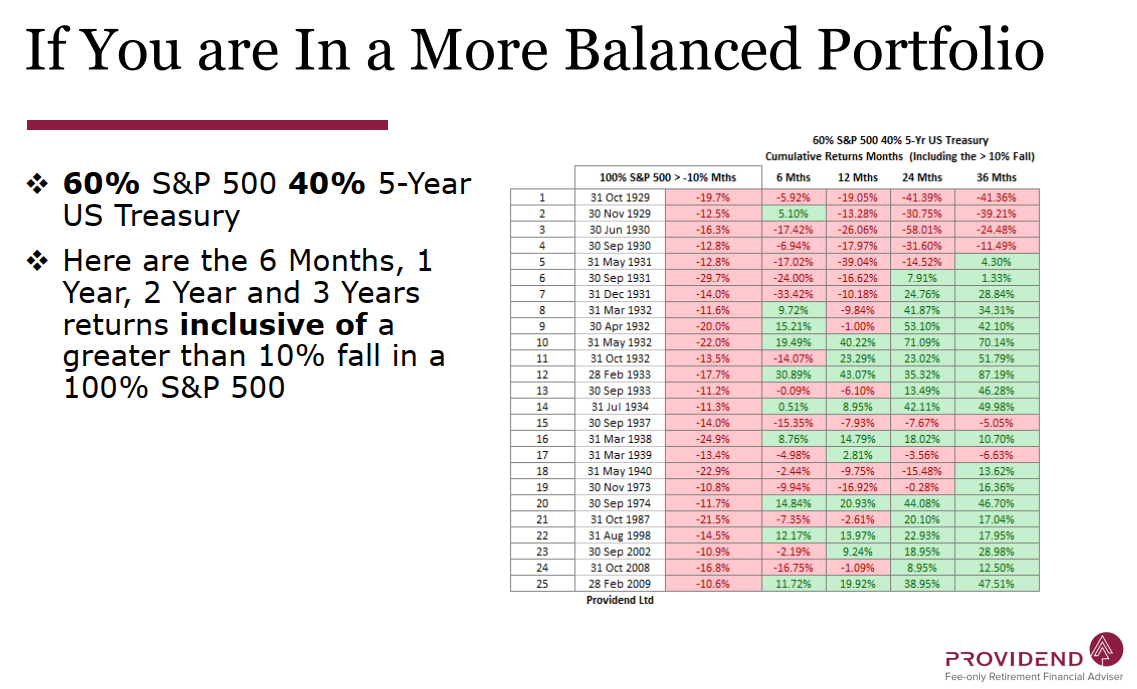
I think you won’t recover faster, but looking at the magnitude of the fall, it is much more livable. 6 months after the fall, if we take out the 1920s and 1930s, the largest fall is -16% on your portfolio and the recovery happens after 1 year.
If you invest after such a large drawdown month
Some of your money would have been invested, and some of your money is going to be invested.
So what if you invest after a greater than 10% monthly fall?
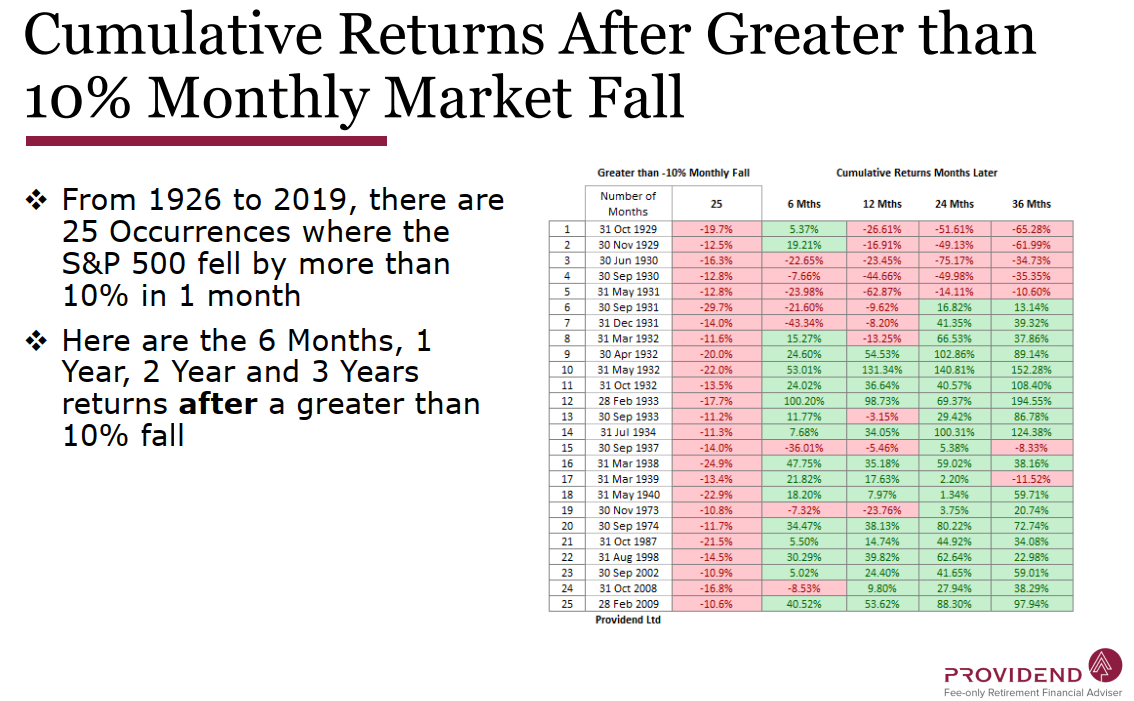
The 1920s and 1930s are damn brutal. I really hope we do not return to those scenarios.
Even if you are 100% cash and invested 1 month after such a fall, 3 years from now your results would still be shit.
But aside from that, the data looks compelling to put more money to work.
When you tranch or dollar cost average into the market, you will capture all these good and poor sequences. If the market goes up over time, then your returns should be alright.
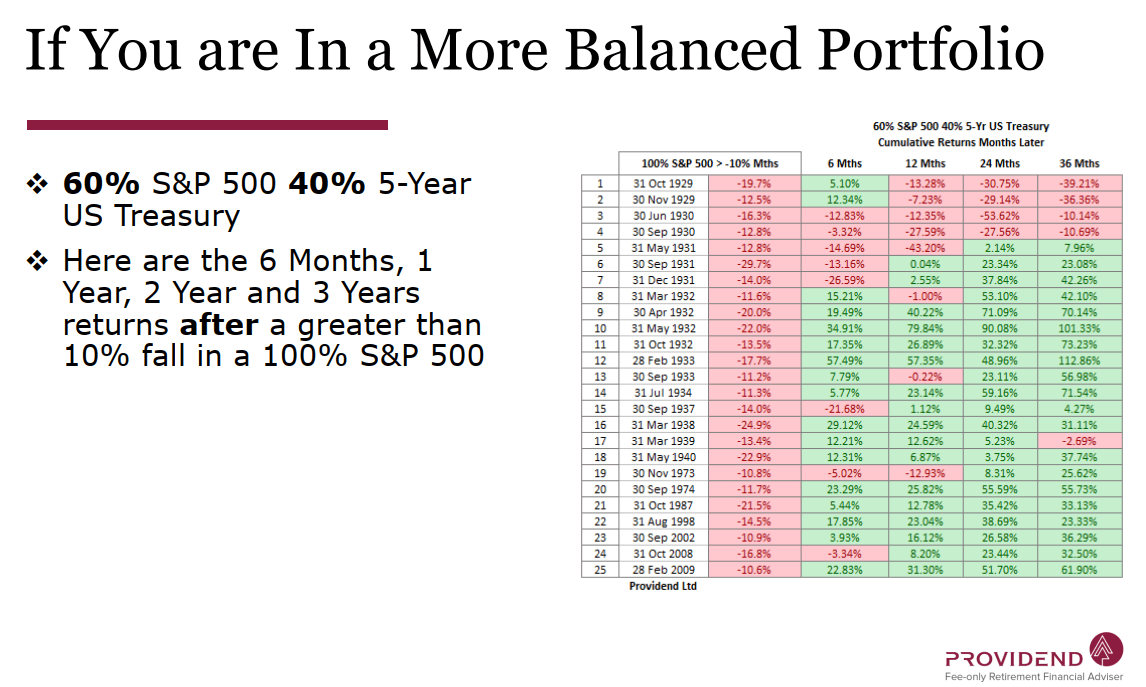
If you are in a balanced portfolio, your returns are not too bad. With a lower volatility, in 6 months’ time, most months you are green while the largest negative month is about 21%.
Duration to Deepest Point
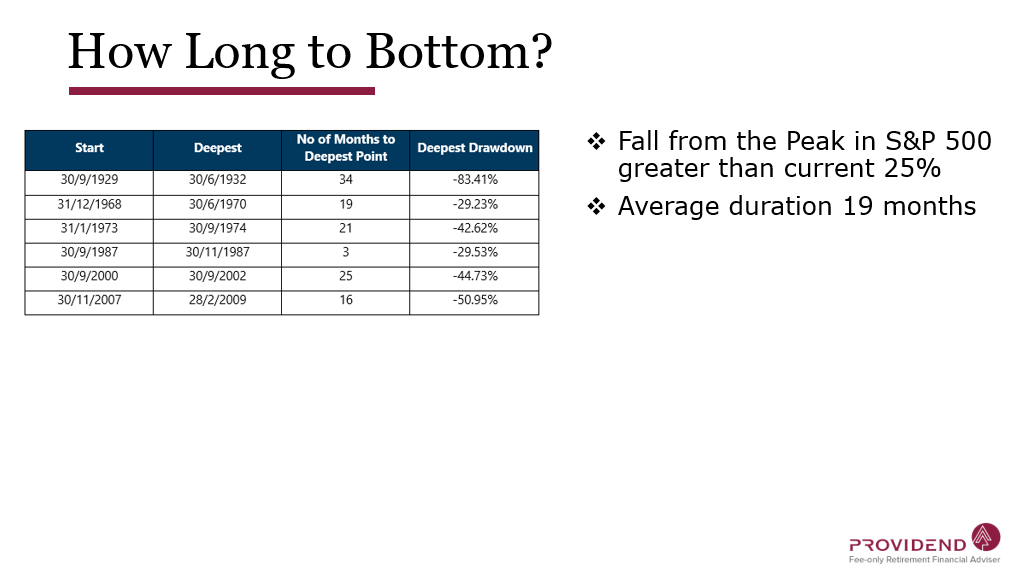
This isn’t rocket science but there are some that rebounded in 3 months and some that took nearly 3 years. On average, it took 19 months to go to the bottom.
So you can use this to pace yourself.
How Long it Takes to Recover
A recovery is a period where prices go down, then comes back up to the original point.
There are about 121 falls from the peak sequences since 1926.

Where we are now, there are again 6 instances where the drawdown is greater than this. The length of time it takes to recover ranges from 2 to 4 years to as long as 15 years (pray that it is not the 15 years)
The difficulty with market timing is that 88% of the time, the fall is less than 10%. If you sit out of them, you missed out on the returns.
Yet each of those 10% to 20% falls feel like the start of a great fall we are seeing now. But they turn right back up and you could not all in.
This is why we always say… stay invested.
Summary
Ok, this took longer than expected. Lack of sleep. Not in a good mood now.
For those who are accumulating your wealth, look upon periods like this as an opportunity to get at a good price.
The math here is that if returns suck in the first 10 years, the returns next 10 years tend to be better. Your time horizon is long. Keep your job and be frugal and put away money regularly.
For those who are invested, there are silver linings based on the data that I have shown. These things are a cycle. Even doggy European countries can do OK.
Some of you might have your risk profile re-calibrated by this event. You think you could take volatility but in actual case, this might be a little harder.
There is a reason we have a portfolio made up of less correlated assets (even though in times like this, you realize they are all correlated!) such as bonds. They act as a cushion to your portfolio.
If you are near retirement, your adviser should have structured your net wealth such that great negative volatility like this should not derail your retirement.
If you are not sure if you are well structured for it, get some help.
The toughest would be the 35 to 50 who are halfway in your journey. You have invested and are still getting there. Stay strong people. (I would probably break this out to another post)
Stay away from crowds and wash your hands.
I invested in a diversified portfolio of exchange-traded funds (ETF) and stocks listed in the US, Hong Kong and London.
My preferred broker to trade and custodize my investments is Interactive Brokers. Interactive Brokers allow you to trade in the US, UK, Europe, Singapore, Hong Kong and many other markets. Options as well. There are no minimum monthly charges, very low forex fees for currency exchange, very low commissions for various markets.
To find out more visit Interactive Brokers today.
Join the Investment Moats Telegram channel here. I will share the materials, research, investment data, deals that I come across that enable me to run Investment Moats.


Do Like Me on Facebook. I share some tidbits that are not on the blog post there often. You can also choose to subscribe to my content via the email below.
I break down my resources according to these topics:
- Building Your Wealth Foundation – If you know and apply these simple financial concepts, your long term wealth should be pretty well managed. Find out what they are
- Active Investing – For active stock investors. My deeper thoughts from my stock investing experience
- Learning about REITs – My Free “Course” on REIT Investing for Beginners and Seasoned Investors
- Dividend Stock Tracker – Track all the common 4-10% yielding dividend stocks in SG
- Free Stock Portfolio Tracking Google Sheets that many love
- Retirement Planning, Financial Independence and Spending down money – My deep dive into how much you need to achieve these, and the different ways you can be financially free
- Providend – Where I used to work doing research. Fee-Only Advisory. No Commissions. Financial Independence Advisers and Retirement Specialists. No charge for the first meeting to understand how it works
- Havend – Where I currently work. We wish to deliver commission-based insurance advice in a better way.
Kyith is the Owner and Sole Writer behind Investment Moats. Readers tune in to Investment Moats to learn and build stronger, firmer wealth foundations, how to have a Passive investment strategy, know more about investing in REITs and the nuts and bolts of Active Investing.
Readers also follow Kyith to learn how to plan well for Financial Security and Financial Independence.
Kyith worked as an IT operations engineer from 2004 to 2019. Currently, he works as a Senior Solutions Specialist in Insurance Start-up Havend. All opinions on Investment Moats are his own and does not represent the views of Providend.
You can view Kyith's current portfolio here, which uses his Free Google Stock Portfolio Tracker.
His investment broker of choice is Interactive Brokers, which allows him to invest in securities from different exchanges all over the world, at very low commission rates, without custodian fees, near spot currency rates.
You can read more about Kyith here.
- New 6-Month Singapore T-Bill Yield in Late-April 2024 to Drop to 3.70% (for the Singaporean Savers) - April 18, 2024
- Golden Nuggets from JPMorgan Guide to Retirement 2024. - April 16, 2024
- Be Less Reliant on Banks and Build Stronger Capital Markets by Pushing for Better Shareholder Dividend and Buyback Yield - April 14, 2024
Gerald Lim
Friday 13th of March 2020
Prefer you to give me a call. Hp 93874588
Kyith
Friday 13th of March 2020
?