Happy May Day.
In the past week, we have seen a lot of stocks listed in the United States release their results. By and large, the results have been good.
Despite the good results, some stocks sold off. Market is trying to price what is going to happen going forward. Or trying to identify the fair value of stocks going forward. Not what the stock is worth in the past.
For some companies, a large part of the intrinsic value of businesses with no earnings today is in the future. If your CEO tells everyone the future is not so rosy, then your share price is going to get wacked.
There are 5 things that caught my attention this week. Some deals with the market sentiments, while others deal with inflation.
Strong PMI and Market Pause
Chris Verrone from Strategas shows us that often when economic data is pretty hot, there would be some sort of a pause and correction.
There also seem to be other periods where there was a market top, but the economic indicator did not run extremely hot.
Economic data just oscillates between high and low. I think it is less indicative of market tops.
Perhaps it is because markets are in an uptrend more than in a downtrend.
It also shows that the only trend is manufacturing data oscillates. Economic data don’t stay permanently low or high.
Inflation Does Not Go Up In a Straight Line
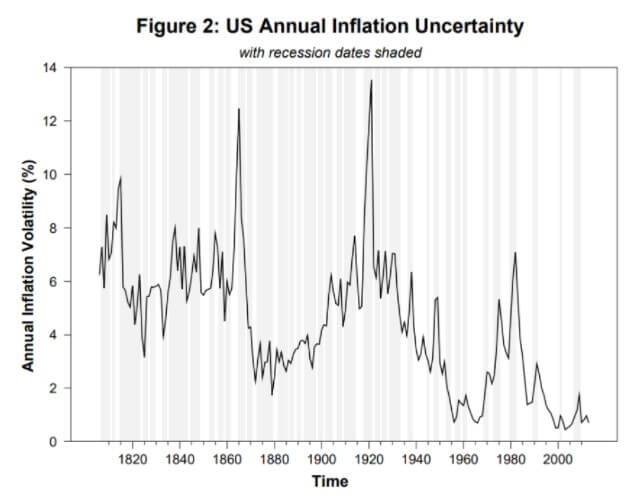
Here is a very long term chart showing the level of volatility in annual inflation figures.
Inflation used to be higher but economic boom and bust also means that the people experience wild swings in inflation, disinflation and deflation. As the country becomes more developed, we seem to observe a downshift in inflation volatility.
So much so that in the past 30 to 40 years, inflation volatility has been extremely low.
Perhaps we are due for a spike, and a spike could ean massive deflation or massive inflation. Either way, markets do not like uncertainty and there will definitely be some volatility in the markets.
Absurd US Used Car Prices
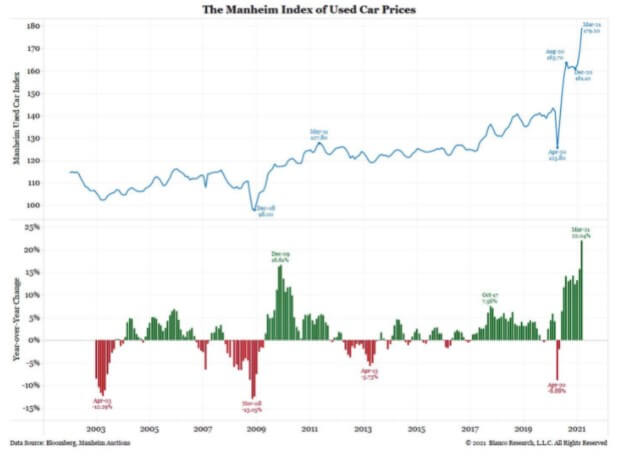
The Manheim consulting firm has conducted research and performance studies for car dealerships and commercial client.
This Manheim index is made up of Manheim’s U Sales that fall into one of the 20 vehicle market classes. This includes things like heavy trucks, motorcycles and you name it.
The index is weighted based on a 24-month rolling average of past sales of vehicles by market class. The prices are adjusted based on mileage.
The typical American used vehicle has appreciated more in value now than the S&P 500.
Basically, supply for every shit is tight. That including used vehicles.
Everytime people say that the money printing is causing inflation, I wonder if it is due to more supply and demand temporary imbalances.
No wonder that the online SAAS used car platform like Carvana (CVNA), Vroom (VRM) were doing very well.
Some say this is rather bullish for the economy (read not the stock market):
- This means the trade-in value of vehicles are high, which will spur new vehicle sales.
- A used car and truck shows that people are willing to spend on durable goods.
A friend of mine tells me this kind of used car price chart is also observed in Australia. We are seeing this supply and demand inbalance played out not just in one country but all over.
The Services that Should be Included in My Financial Planning Fees
Any time I pay a fee for something, I want to know what I am paying for.
If I know these are the line-items, I can effectively value whether the fee I am paying is worth it.
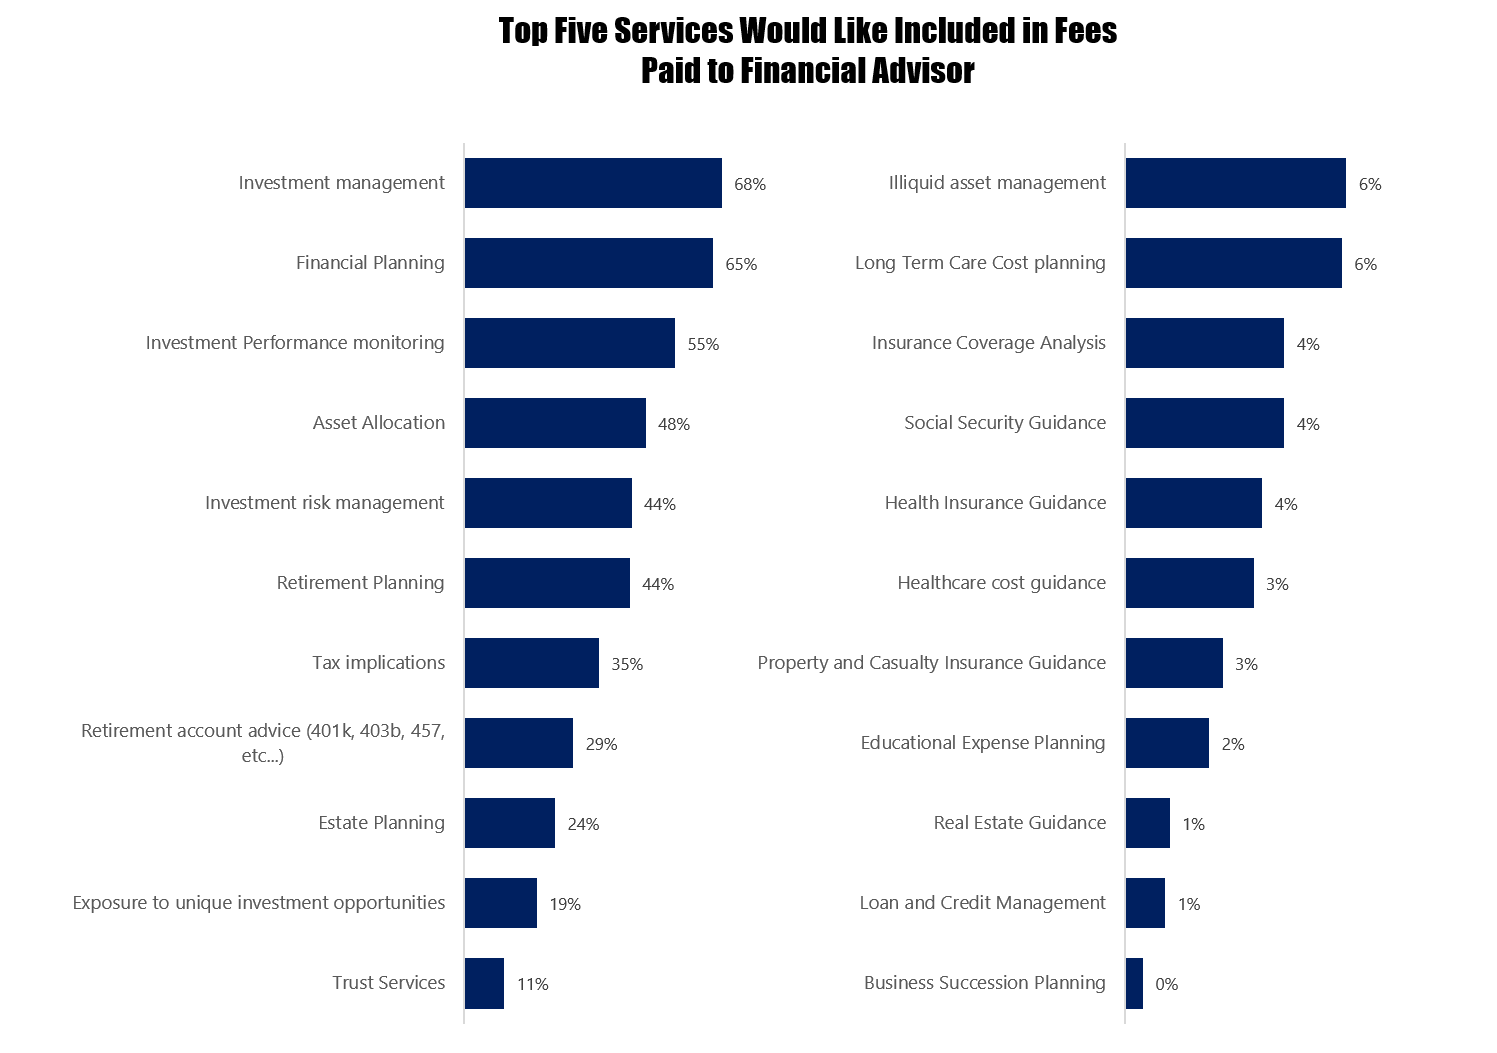
Advisorpedia has this chart that shows us the services clients want to be included in the fees paid.
Four of the top are investment related:
- Investment management.
- Investment performance monitoring.
- Asset Allocation.
- Investment risk management.
Can you DIY #1, #2 and #3? Begrudgingly, most can do a reasonable job. But there is always that “Am I doing it the right way?” feeling. I would contend that majority of the value is in the Investment management and risk management on a recurring basis.
Three of the top are financial planning related:
- Financial planning
- Retirement planning
- Tax implications
#3 is huge in the US. In a complex tax system, you can add 1-2% a year if you do #3 well.
Scatter Plot of EV / NTM Revenue Multiple vs NTM Growth
Jamin Bell has a scatter plot diagram of all the popular and less popular SAAS companies out there.

EV stands for enterprise value which is a combination of debt plus market capitalization minus the cash.
NTM stands for next twelve months.
This basically plots the valuation for non-current-cashflow-generating business against their growth rate. Below the line and to the right indicates their valuation is low relative to their growth rate.
This is useful, if you trust that price to sales is a good measure of things. Use this to screen for good prospects and not use this as the be-all-and-end-all.
I invested in a diversified portfolio of exchange-traded funds (ETF) and stocks listed in the US, Hong Kong and London.
My preferred broker to trade and custodize my investments is Interactive Brokers. Interactive Brokers allow you to trade in the US, UK, Europe, Singapore, Hong Kong and many other markets. Options as well. There are no minimum monthly charges, very low forex fees for currency exchange, very low commissions for various markets.
To find out more visit Interactive Brokers today.
Join the Investment Moats Telegram channel here. I will share the materials, research, investment data, deals that I come across that enable me to run Investment Moats.


Do Like Me on Facebook. I share some tidbits that are not on the blog post there often. You can also choose to subscribe to my content via the email below.
I break down my resources according to these topics:
- Building Your Wealth Foundation – If you know and apply these simple financial concepts, your long term wealth should be pretty well managed. Find out what they are
- Active Investing – For active stock investors. My deeper thoughts from my stock investing experience
- Learning about REITs – My Free “Course” on REIT Investing for Beginners and Seasoned Investors
- Dividend Stock Tracker – Track all the common 4-10% yielding dividend stocks in SG
- Free Stock Portfolio Tracking Google Sheets that many love
- Retirement Planning, Financial Independence and Spending down money – My deep dive into how much you need to achieve these, and the different ways you can be financially free
- Providend – Where I used to work doing research. Fee-Only Advisory. No Commissions. Financial Independence Advisers and Retirement Specialists. No charge for the first meeting to understand how it works
- Havend – Where I currently work. We wish to deliver commission-based insurance advice in a better way.
Kyith is the Owner and Sole Writer behind Investment Moats. Readers tune in to Investment Moats to learn and build stronger, firmer wealth foundations, how to have a Passive investment strategy, know more about investing in REITs and the nuts and bolts of Active Investing.
Readers also follow Kyith to learn how to plan well for Financial Security and Financial Independence.
Kyith worked as an IT operations engineer from 2004 to 2019. Currently, he works as a Senior Solutions Specialist in Insurance Start-up Havend. All opinions on Investment Moats are his own and does not represent the views of Providend.
You can view Kyith's current portfolio here, which uses his Free Google Stock Portfolio Tracker.
His investment broker of choice is Interactive Brokers, which allows him to invest in securities from different exchanges all over the world, at very low commission rates, without custodian fees, near spot currency rates.
You can read more about Kyith here.
- New 6-Month Singapore T-Bill Yield in Late-April 2024 to Drop to 3.70% (for the Singaporean Savers) - April 18, 2024
- Golden Nuggets from JPMorgan Guide to Retirement 2024. - April 16, 2024
- Be Less Reliant on Banks and Build Stronger Capital Markets by Pushing for Better Shareholder Dividend and Buyback Yield - April 14, 2024