The growth rate of my parent’s HDB in Seng Kang is 2.27% a year. We had this place for 21 years.
The growth rate of an HDB flat is not something we monitor on a frequent basis. There are enough financial figures that I have an eye on that I can monitor a figure less.
I didn’t understood this in the past but now I understand why accountants don’t prospect stocks the way they should. You see so much financial numbers sometimes you feel like vomiting.
There were 3 things that triggered this post.
The first was one real estate agent pamphlet. It is one of those pamphlets we have gotten in our letterbox.
It shows that the last transacted price for a similar floor and similar sized home is $435,000. Since the recent peak 6 years ago in 2013, I don’t recall if prices actually climbed. Then again, I did not monitor much as well.
The second thing was a recent Hardwarezone post that was brought to my attention. Someone bought a 20-year old flat in Seng Kang at $480,000 and now it is only valued at $380,000. What surprised me was whether our flat has consistently go below the magical $400,000 price point and we can never go close to the $500,000 price point again.
The final factor was how all these figures would look in my property investment spreadsheet. I dumped a few commonly used property calculation into this spreadsheet.
One part of the calculation is the rate of return in XIRR you would get if you sell off your property with different leverage levels, different growth rates, and different rental rates.
In this post, I wanted to see how 2 flats performed, through the lenses of my spreadsheet. The first one is mine and the second one is my friend Caveman’s Cave in a slum part of Singapore.
The Complexity of Property Returns Forecast Calculations
The returns you get from your properties depends on a myriad of factors:
- There are many cash outflows (renovations & furnishings, not just once but a few times, rental expenses, interest payments, principal repayment)
- There are some cash inflows (rental income, rent that you saved had you not had a flat)
- Your leasehold property decays (typically with the Bala Curve)
- Your property grows due to supply and demand, controlled by government measures, augment by inflationary forces
- You take on different levels of leverage
Your returns are a function of the above (if I missed out do let me know)
Ideally, the calculator should more or less let you vary these things well, then give the XIRR.
The Seng Kang Flat
If you go to the HDB Portal, key in your SingPass, you can find out a fair bit of information about your flat.
Here are some details of the flat:
- 5-Room HDB
- Flat Model: Improved (at least back then, now it’s like…)
- Floor Area: 122 square meter
- Date of Purchase: 1 Feb 1998
- Purchase price: $264,500
- Mortgage at Start: $67,000
- Loan Tenure: 25 years
- Mortgage left now: $11,741
- Tenure till now: 21.75 years
- HDB Interest Rate: 3.16%
- Value of Last Comparable Sales: $435,000
- Lease left: 77.25 Years Left
- Renovation cost: $30,000
So we can key in as much of this as possible and see what my spreadsheet throws back at me.
Valuation of the Flat
Taking $435k and $264k, we can work out what is the compounded average growth for the past 21.75 years to be close to 2.27%.
That is less than the compounded return you would get from an insurance endowment plan (check out some crowdsourced insurance endowment returns here)
But let me just roughly put in the long term growth to be 2.70%.
There are 2 opposing forces driving asset prices:
- Leasehold decay
- Asset appreciation
Asset appreciation outweighs decay first, then decay will outweigh asset appreciation.
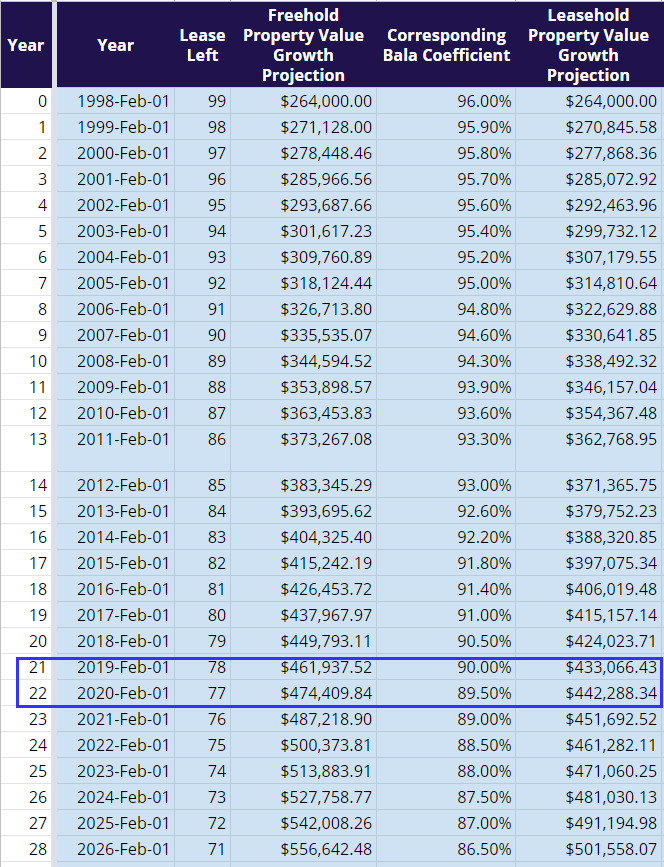
In this table, the calculator list out the first 28 years of the flat’s history. A new HDB flat has 99 years of lease which starts running down.
If it is freehold instead, there should be no land value decay. The difference between a freehold and a leasehold in Singapore are usually represented by this Bala Coefficient. It shows the amount of value left of the freehold.
So if my flat’s freehold value is $474,409, the current leasehold value is only 89.5% of that value, which is $442,288.
For the first 20 years, the decay is less than significant. It will pick up after 20 years, accelerate after 40 years and super accelerate after 70 years.
The value of my flat looks on point with the Bala Coefficient. I think if I have the private or public property’s starting value, this part of the calculator works.
But suppose if you wish for me to compute a flat that is 23 years old, then I would have a dilemma if my calculator works well. That is an exercise for another day.
How would our flat’s value progress from now onwards?
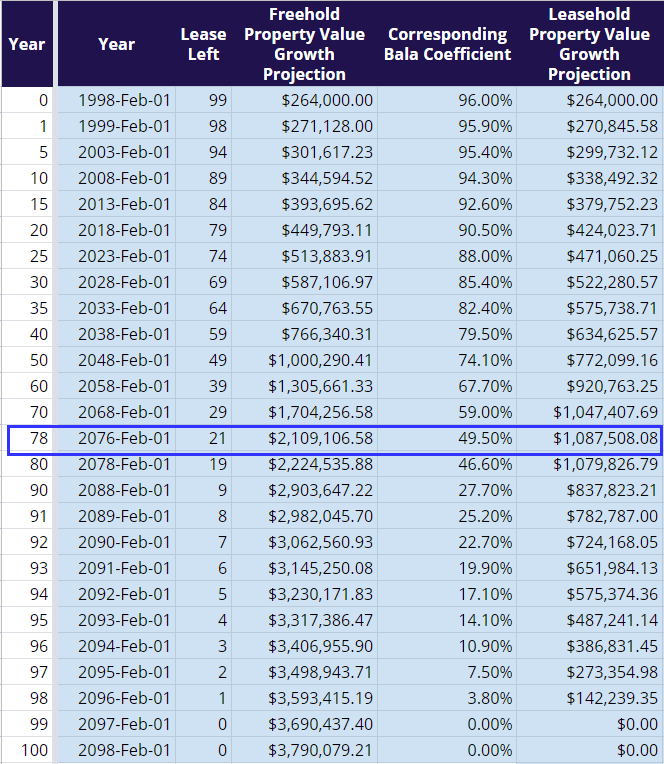
I have decided to hide some of the rows. The value of the leasehold goes up and peak at 78 years and then the decay accelerates.
I rest assure that 50 years later when I am gone, our flat is worth 1 million dollars.
If you remember, our government decided to appease the citizen’s need for SERS by introducing the VERS. (you can read my in-depth post here)
VERS was proposed when your flat is about 70 years old. This is probably the right time based on my spreadsheet as the value of the flat will head downwards near 80 years old.
Not Knowing How to Calculate Returns May Overrate the Asset
Our flat’s value is still 62% higher than our purchase price.
This looks like a good reason to be invested in property. But we held on for 21.75 years. If you compute the compounded average growth, it is paltry versus equity returns which is above 5% a year.
The average inflation rate for the period is less than 1.6% so our property barely got a positive real return.
What is Your Return If You Sell It at Year X?
Of course, the asset growth is only part of the return computation.
To compute your return, you have to factor in a few things:
- Our principal and interest repayment over 25 years
- Our renovation cost of $30,000
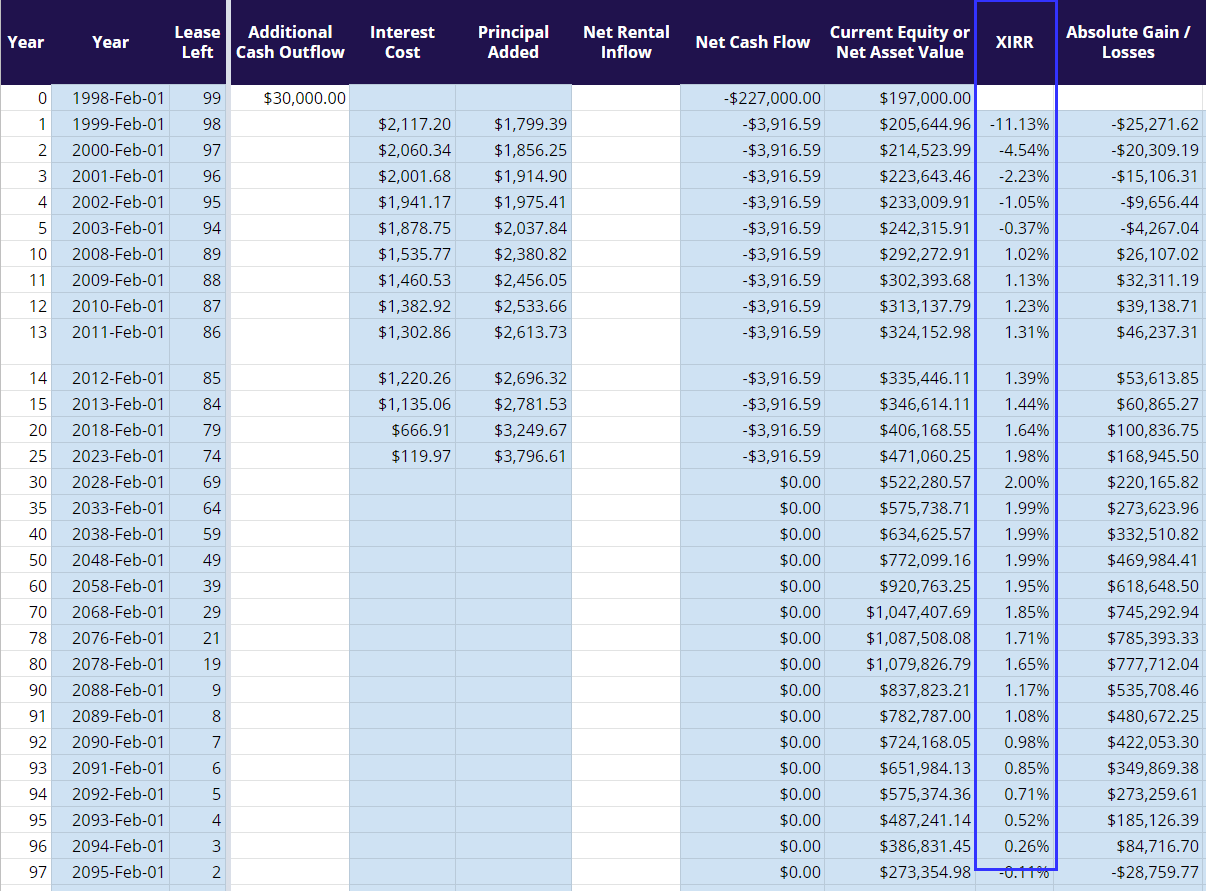
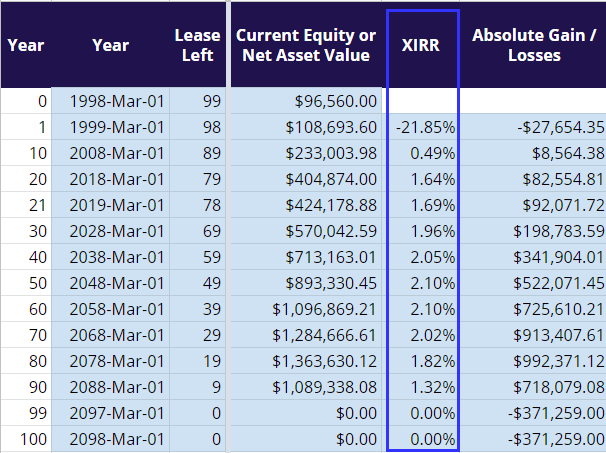
The spreadsheet allows me to factor in the cash outflow and cash inflow. In the XIRR column, the spreadsheet computes the XIRR (or the interest rate per year on my net cash flow over the years) if I sell it off at that year.
For example, if I sell off the flat on Feb 2018, the XIRR would be 1.64%. I have put in $274,000 over the past 20 years and have gotten an absolute gain of $100,000 in Feb 2018.
If I sell-off in the first year, the XIRR would be -11.13%.
At this rate, even if I keep the flat for 80 years, this return will be only as good as the Singapore Savings Bonds.
Should We Factor in Rental Expense Saved?
The unique thing about property is that… it is one investment that you could live inside.
You cannot buy an ETF and live in one of the properties owned by a stock in the ETF. But you can live in the property.
If you did not buy this property and invest in something else, you would also need to rent a place to stay (unless you played cheat and stayed in your parent’s place)
So the rental expense saved can be your return.
So how do we compute this? On HDB’s portal, we can find the last transacted rental rate as well.

$1900 a month. Gone are the days where I would have to rent for $2,400 a month. Rental growth had been slow for some time so we can work backward the rental expense we would save for the past 21 years.
I use a rental growth rate of 1.5% a year.
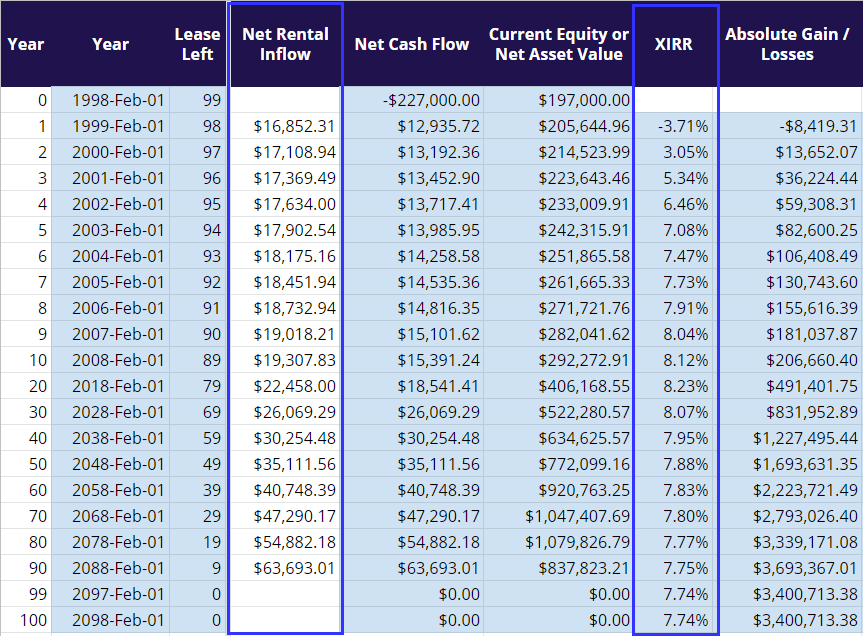
When we factor in modest rental income saved (Net Rental Inflow), the XIRR goes up to nearly 8%.
You will realize as the leasehold decays, the XIRR stayed near a high 7.7% rate. This is a very good return.
Next to the XIRR, under Absolute Gain/Losses, I have computed the net cash inflow if you sell off at year X.
At year 20, the rental expense saved and the net gains from the sale will come up to a gain of $491,401 (this factors in the initial cash outlay of $227,000 if you are asking)
Can we infer that our investment property will have this return? I think depending on your growth rate the figures will look rather different. This will likely be in a future article.
Caveman’s Cave
Caveman’s Cave lies in a part of Singapore you would considered a slum. Surprisingly Caveman purchased this 1 month after me.
Let us assume Caveman took an 80% mortgage and uses an HDB loan.
- 5-Room HDB
- Flat Model: Improved (at least back then, now it’s like…)
- Floor Area: 121 square meter
- Date of Purchase: 1 Mar 1998
- Purchase price: $209,300
- Mortgage at Start: $167,440
- Loan Tenure: 25 years
- Mortgage left now: $11,741
- Tenure till now: 21.65 years
- HDB Interest Rate: 3.16%
- Value of Last Comparable Sales: $400,000
- Lease left: 77.35 Years Left
- Renovation cost: $30,000
Caveman’s Cave cost at least $50,000 less than mine but in terms of appreciation, it absolutely trounced our Seng Kang flat.
Growth in Cave Asset Value
The compounded growth rate is nearly 3%. This slum is not too bad.


If I were to use 3.5% a year in asset growth, the leasehold value will show up as $403,422.
Caveman’s XIRR Returns
The following table shows the returns without factoring in rental expense saved:
The returns, if you sell off at any point does not look good.


If we factor in the rental expense saved, the XIRR peaked at 16.8% in year 10, if you sell it off. The terminal XIRR is nearly 13%.
Caveman’s Cave rents at almost the same rate as mine, but cost much less for him. The rent savings is enormous.
Is it Right to Account for Rent Expense Saved as a Return?
I used to say that if you are not renting out then the return you will get is less than if it is an investment property.
However, in a certain way, you cannot refute that had you rented it out, you would have to expense it in some ways.
This is a bit like whether to consider factors in the increase in income tax payable due to rental.
Like your income tax payable, the rental expense that you would otherwise pay for needs to be accounted for in some ways.
What is less accurate is that given the choice, you might not rent at Seng Kang. You might want to rent at a place that is either cheaper, closer to your workplace and all. We can only assume that you are very comfortable living in this part of Seng Kang and therefore the alternative is to rent in Seng Kang.
Early Retirement Now have an article titled How To “Lie” With Personal Finance – Part 2 (Homeownership Edition) that further explains this.
His data show that the returns of property is not as inferior as what they say compared to equities.
For the Guy Who Bought at the Peak
If you have bought at the peak, eventually, if you live there long enough, the rental expense you saved would “breakeven” what you paid for the property.
This reasoning would only work if you are living in the flat.
If you sell it, you got to find some other place to live in. You are likely to realize this loss, and suffer from not having a place to stay.
Conclusion
It looks like my calculator is doing OK in this scenario but I think it will break down when we simulate something in the middle of its leasehold tenure.
Both Caveman and my flat does not look well due to capital appreciation.
However, if we reason from rental expense saved, the returns look really good.
Still, I wonder what that accomplishes.
We ensure for 99 years, we do not have to pay rental income. But we cannot realize the HDB flat as we are living in it. We also cannot rent it out.
Basically, this investment, when married with a purpose you really need, is really limited.
Let me know what you guys think. My next article should be some Condo exploration.
I invested in a diversified portfolio of exchange-traded funds (ETF) and stocks listed in the US, Hong Kong and London.
My preferred broker to trade and custodize my investments is Interactive Brokers. Interactive Brokers allow you to trade in the US, UK, Europe, Singapore, Hong Kong and many other markets. Options as well. There are no minimum monthly charges, very low forex fees for currency exchange, very low commissions for various markets.
To find out more visit Interactive Brokers today.
Join the Investment Moats Telegram channel here. I will share the materials, research, investment data, deals that I come across that enable me to run Investment Moats.


Do Like Me on Facebook. I share some tidbits that are not on the blog post there often. You can also choose to subscribe to my content via the email below.
I break down my resources according to these topics:
- Building Your Wealth Foundation – If you know and apply these simple financial concepts, your long term wealth should be pretty well managed. Find out what they are
- Active Investing – For active stock investors. My deeper thoughts from my stock investing experience
- Learning about REITs – My Free “Course” on REIT Investing for Beginners and Seasoned Investors
- Dividend Stock Tracker – Track all the common 4-10% yielding dividend stocks in SG
- Free Stock Portfolio Tracking Google Sheets that many love
- Retirement Planning, Financial Independence and Spending down money – My deep dive into how much you need to achieve these, and the different ways you can be financially free
- Providend – Where I used to work doing research. Fee-Only Advisory. No Commissions. Financial Independence Advisers and Retirement Specialists. No charge for the first meeting to understand how it works
- Havend – Where I currently work. We wish to deliver commission-based insurance advice in a better way.
Kyith is the Owner and Sole Writer behind Investment Moats. Readers tune in to Investment Moats to learn and build stronger, firmer wealth foundations, how to have a Passive investment strategy, know more about investing in REITs and the nuts and bolts of Active Investing.
Readers also follow Kyith to learn how to plan well for Financial Security and Financial Independence.
Kyith worked as an IT operations engineer from 2004 to 2019. Currently, he works as a Senior Solutions Specialist in Insurance Start-up Havend. All opinions on Investment Moats are his own and does not represent the views of Providend.
You can view Kyith's current portfolio here, which uses his Free Google Stock Portfolio Tracker.
His investment broker of choice is Interactive Brokers, which allows him to invest in securities from different exchanges all over the world, at very low commission rates, without custodian fees, near spot currency rates.
You can read more about Kyith here.
- Golden Nuggets from JPMorgan Guide to Retirement 2024. - April 16, 2024
- Be Less Reliant on Banks and Build Stronger Capital Markets by Pushing for Better Shareholder Dividend and Buyback Yield - April 14, 2024
- The LionGlobal APAC Financials Dividend Plus ETF Won’t Give Singapore Investors 5% Dividend Yield Always. Further personal thoughts (with some data). - April 13, 2024
Kh
Saturday 7th of December 2019
I am guessing the towns in the west or northern areas like Jurong West, Woodlands , just gut feel.
How are the figures like the net asset value and absolute gain/loss computed from the HDB info ? Are there openly published rental historical growth figures for each estate ? Otherwise,selecting a rental growth rate also appears to be an art and this can affect the xirr computations as well.
Where are the Bala coefficients taken from ?
Is the spreadsheet something we can build ourselves and use it for future planning such as for selling of our flats ?
Sinkie
Sunday 24th of November 2019
Interesting! I guess imputed rents need to be considered if calculating holistic returns. Reminds me of the old Dr Money articles in the New Paper.
2 things to consider: - "subsidised" new HDB will exaggerate capital growth, even more so with all the grants.
- rental yield (whether actual or imputed) tends to be higher for HDB then condos.
Hence I suspect the figures for private properties won't be as good.
Anyway will let your subsequent article do the talking!
Kyith
Sunday 24th of November 2019
HI Sinkie, the growth rate might look entirely different.
Jeremiah
Sunday 24th of November 2019
Where is slum area?
Kyith
Sunday 24th of November 2019
Cannot say HAHA! For anonymity sake! You can try guessing!