There are two powerful forces that dominate finance:
- Momentum
- Reversion to the mean
The first force is often associated with the momentum factor. The stocks that did well continue to do well. In a way, market capitalization based indexes are like a mild momentum play.
The second force tells us that all good things must come to an end. A stock or asset class that is too cheap versus its intrinsic value will have to revert to its fair value. A stock or asset class that is too expensive would have to come back down to earth.
It should be noted that momentum is rather interesting in that it does not have to be expensive things. Cheap things can develop momentum as well.
For a long time, many thought leaders pointed out that we get more momentum and less reversion to the mean is due to cheap money from quantitative easing.
This is a phenomenon that happened in the past 10 years (not always true, we have rather short memories)
I think the market got really spooked when the minutes of the recent Fed meeting reveal that the tone is more hawkish than what the consensus believes. There is a debate on how much tightening has to take place. It is between hawkish versus very hawkish.
The possible difference between this time and in the past is that, for the past 10 years, inflation has been in control.
Back in 2018, when the market tells the Fed they cannot take it, inflation is still low and they can do QE again.
Now there is meaningful inflation.
This might mean that the governments cannot readily play that game of liquefying markets with cash so easily. With less liquidity, money is going to be rather tight and markets are likely going to get more volatile with drawdowns of bigger magnitude and also more recoveries but perhaps for the next 10 years, we end up going nowhere in real terms.
With higher interest rate means that we have to respect current cash flows more than future cash flows.
And so companies with greater current cash flow relative to their value may start to look more appealing.
We are already seeing it at the start of this year.
Now, I am on the fence about whether this inflation is going to be prolonged. I believe there are some things such as energy that people are underestimating the required supply but for some stuff in Q1 or 2 we should see moderation.
It just means the market is going to be more volatile with some swings.
I really dunno how to play this shit.
But I reckon that some of you might be wondering if I want to shift some of my exposure to more value companies, what are my options?
There are unit trusts that are more value-focused. However, you might struggle to find an active value manager that is able to keep pace with their value index let alone beat it on the retail level.
Today, I am going to list at least 11 UCITS ETFs listed on the London Stock Exchange that is more tilted towards value. These UCITS ETFs are domiciled in Ireland and therefore more tax-efficient if you wish to have fewer complications passing your wealth to the next generation (Read some of my articles on withholding taxes and estate taxes here).
You can purchase these ETFs through a brokerage platform that allows you to trade on the London Stock Exchange. Interactive Brokers is a broker that allows you to do that, reputable and very cost-efficient.
I think the ETFs active or passive that tilted towards value has more variety in the US and I may choose to talk about them in another article but lets go through the value ETF options on LSE.
iShares Edge MSCI World Value Factor UCITS ETF (Ticker: IWVL) – The biggest AUM value ETF listed on LSE
IWVL is probably the go-to for most if they wish to tilt their MSCI World portfolio to a little more value.
Here are some details about the IWVL:
- Provider: BlackRock
- Index Tracked: MSCI World Enhanced Value Index.
- Since it drills down from MSCI World, the companies are predominately large-capitalization companies around the world.
- Denominated in: USD
- Domicile: Ireland
- Rebalances: Every half a year.
- Number of holdings: 400
- Expense ratio: 0.30%
- Current PE: 15.22
- Current PTB: 1.37
- AUM: 4.7 billion
- Incepted: Oct 2014
- Link to IWVL ETF
- Index Methodology
The Enhanced Value Index ranks the companies in the MSCI World based on a composite value index that equal-weights forward price-to-earnings, enterprise value divide by operating cash flows and price-to-book value.
This method of valuation would probably factor in companies with more intangibles, compared to if companies are valued based on price-to-book.
This would factor in more high-quality companies who may have high price-to-book but their forward earnings are good. They would be prioritized for this index.

MSCI provided a good view of how the index did in recent times. Recent results have not been good but if we go back to when this index was incepted (1997), the value index did better.
To be fair, while the last 5-10 years results fall short of the MSCI World, 7.6-9% a year annualized returns are decent.
IWVL but distributing dividends (Ticker: IWVU)
The current dividend yield of the index is 2.58% and so if you prefer a version of IWVL that distribute dividends, you can check out IWVU.
Based on 2021’s distribution and today’s price the dividend yield is 2.56%. Dividends are not consistent. The mandate of this fund is not to give you a consistent dividend.
iShares Edge MSCI Europe Value Factor UCITS ETF (Ticker: IEVL)
IEVL uses the same value methodology as IWVL, but it allows you to be more targeted and focus on value companies in Europe.
Here are some details about the IEVL:
- Provider: BlackRock
- Index Tracked: MSCI Europe Enhanced Value Index.
- Since it drills down from MSCI Europe, the companies are predominately large-capitalization companies in Europe.
- Denominated in: EUR
- Domicile: Ireland
- Rebalances: Every half a year.
- Number of holdings: 150
- Expense ratio: 0.25%
- Current PE: 15.68
- Current PTB: 1.36
- AUM: 2.8 billion EUR
- Incepted: Jan 2015
- Link to IEVL ETF
I shall not go too much into the methodology as it is the same as IWVL. Her is MSCI’s profile of the index:
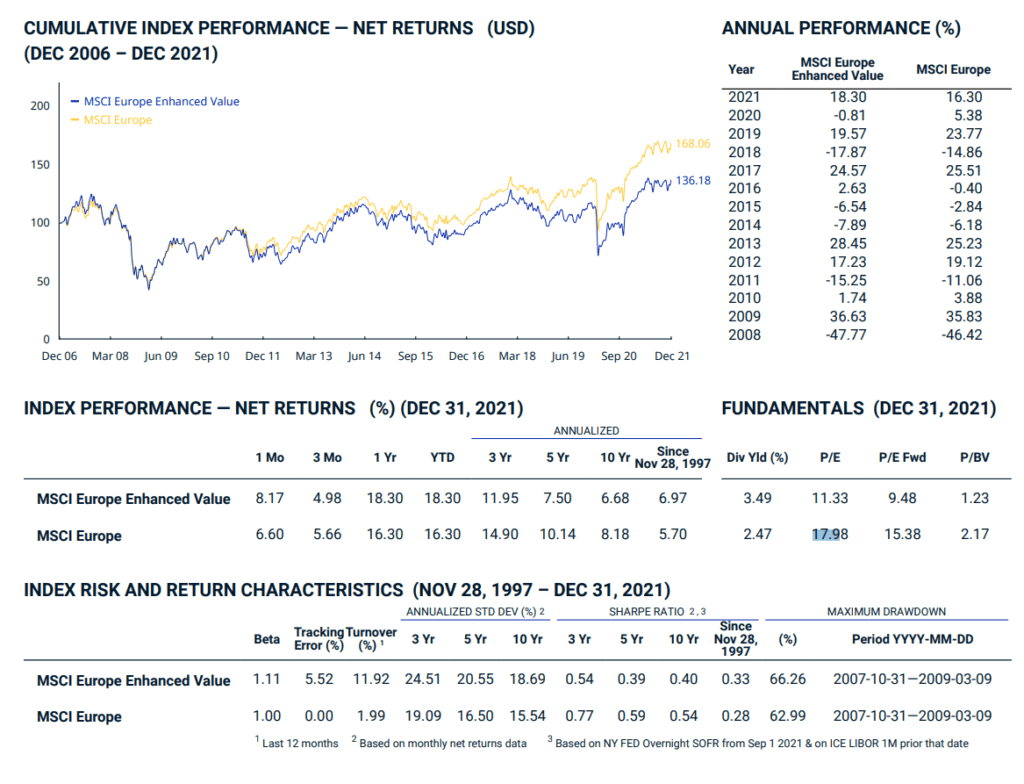
A common theme that you see is underperformance in the past years but if we go back to when the index is incepted, there is outperformance.
IEVL but distributing dividends (Ticker: IEDL)
IEVL also have a distribution class with the ticker IEDL.
Based on the current unit price, the dividend yield is about 3.45%.
Europe and Emerging Markets probably have the highest dividend yields.
iShares Edge MSCI USA Value Factor UCITS ETF (Ticker: IUVL)
IUVL is similar to IWVL and IEVL. It is more catered to the investors who are mostly the US but would like a more dividend and estate-tax efficient option.
Here are some details about the IUVL:
- Provider: BlackRock
- Index Tracked: MSCI USA Enhanced Value Index.
- The index drills down MSCI USA. MSCI USA currently has 628 stocks and covers 85% of the free-float adjusted market capitalization of the US. It is less strict on the number of companies that can be listed than S&P 500, which means companies that do not have earnings such as Tesla could be listed.
- Denominated in: USD
- Domicile: Ireland
- Rebalances: Every half a year.
- Number of holdings: 149
- Expense ratio: 0.25%
- Current PE: 18.71
- Current PTB: 2.10
- AUM: 3.3 billion
- Incepted: Oct 2016
- Link to IUVL ETF
I shall not go too much into the methodology as it is the same as IWVL. Her is MSCI’s profile of the index:
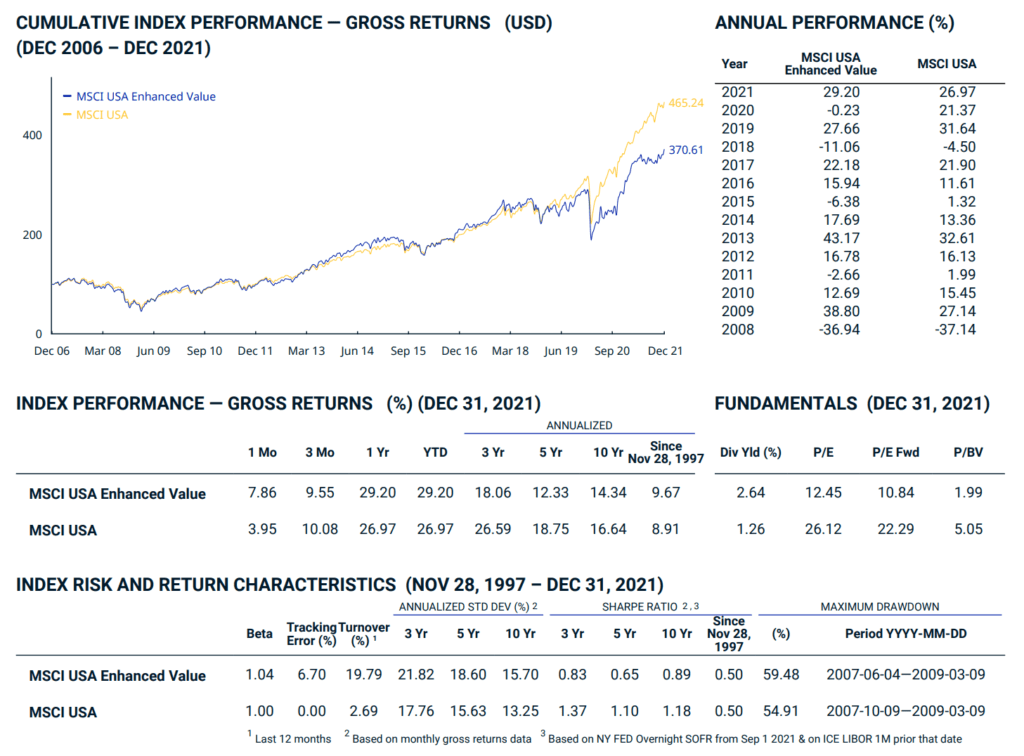
The United States is probably the market that is more expensive, but if we overlay a value layer, we can get large caps with lower price-earnings.
I think the glaring downside would be the 2020 performance, where the MSCI USA Enhanced Value index did -0.23% while the MSCI USA did 21%. This is hard to stomach.
We will notice that value does not mean that it will help you cushion the drawdowns in the past 14 years. Rather, when the MSCI World is not performing that well, the value index did even worse.
The only negative period where the value index did better was during the great financial crisis.
I think folks would zero-ed in on the underperformance in the last 5 years. The Enhanced Value index did 12.3% a year versus 18.75% a year for the MSCI USA. In the last 10 years, the Enhanced Value index did 14.3% a year versus 16.6% a year.
I think there is underperformance, but mainly because some of the forward PE, PTB and EV/CFO premium fails to show up.
But in a way, those are still decent returns.
IUVL but distributing dividends (Ticker: IUVD)
IUVL also have a distribution class with the ticker IUVD.
Based on the current unit price, the dividend yield is about 1.8%.
iShares Edge MSCI EM Value Factor UCITS ETF (Ticker: EMVL)
In recent years, BlackRock also came up with a value factor ETF which may be suitable for the investors who like the emerging markets but are less tilted towards technology or the companies with fewer earnings.
Here are some details about the EMVL:
- Provider: BlackRock
- Index Tracked: MSCI EM Select Value Factor Focus Index
- The index drills down the large and mid-cap companies in emerging markets.
- Denominated in: USD
- Domicile: Ireland
- Rebalances: Every half a year.
- Number of holdings: 198
- Expense ratio: 0.25%
- Current PE: 10
- Current PTB: 1
- AUM: 152 million
- Incepted: Dec 2018
- Link to EMVL ETF
The methodology is different from the previous BlackRock ETFs mentioned before in that it seeks a larger exposure to the value factor compared to the MSCI Emerging Markets index.
This means that certain industries that are more undervalued can be much bigger than the MSCI Emerging Markets or the Enhanced Value index (and vice versa)
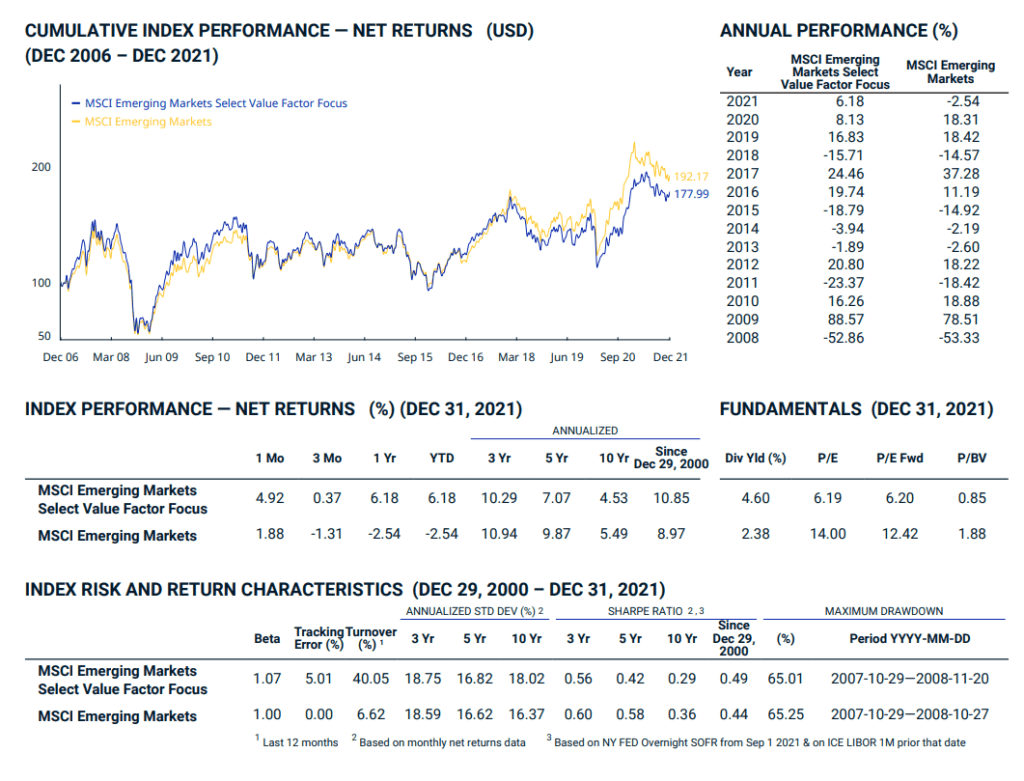
Over the last 5 to 10 years, the Select Value Factor index underperformed the MSCI Emerging Markets. But the gap is much wider than if the Enhanced Value index is applied.
For example, if we compare the 10-year performance, MSCI Emerging Markets did 5.49% a year, Select Value Factor did 4.53% a year. The Enhanced value would have done 5.28% a year.
I am not sure why BlackRock decide to go with that.
XTrackers MSCI World Value UCITS ETF 1C (Ticker: XDEV)
DWS Group under Deutsche bank has an ETF that tracks the same index as IWVL. It is 5 basis points cheaper and in GBP. This fund was incepted 1 month earlier than IWVL but strangely its AUM did not grow that fast.
I will not go too much into it but here are its details:
- Provider: DWS
- Index Tracked: MSCI World Enhanced Value Index.
- Since it drills down from MSCI World, the companies are predominately large-capitalization companies around the world.
- Denominated in: GBP
- Domicile: Ireland
- Rebalances: Every half a year.
- Number of holdings: 400
- Expense ratio: 0.25%
- Current PE: 15.22
- Current PTB: 1.37
- AUM: 711 million pounds
- Incepted: Sep 2014
- Link to XDEV ETF
SPDR® MSCI World Value UCITS ETF (Acc) – Value and Less Negative Quality (Ticker: WVAL)
State Street also have a set of MSCI World Value ETFs that is a little different from the Enhanced Value indexes.
This is a rather new ETF.
State Street have both a USD and a GBP share class.
Here are some details about the WVAL:
- Provider: State Street
- Index Tracked: MSCI World Value Exposure Select Index
- The index drills down MSCI World
- Denominated in: USD
- Domicile: Ireland
- Rebalances: Every half a year.
- Number of holdings: 347
- Expense ratio: 0.25%
- Current PE: 11
- Current PTB: 1.3
- AUM: 50 million
- Incepted: Sep 2020
- Link to WVAL ETF
- Link to Index Methodology
The interesting thing about WVAL is that it ranks the stocks based on the composite value of Enhanced Value (of the IWVL) but additionally it also tries to avoid companies that have poor quality.
So instead of screening for companies with low debt, good profitability, this index de-emphasizes the companies with poorer quality.
This is a little similar to Dimensional Fund Advisors. Dimensional does reduce the weightage of stocks that fall into value and low profitability, while they increase the weightage of small-cap stocks that fall into value and low profitability.
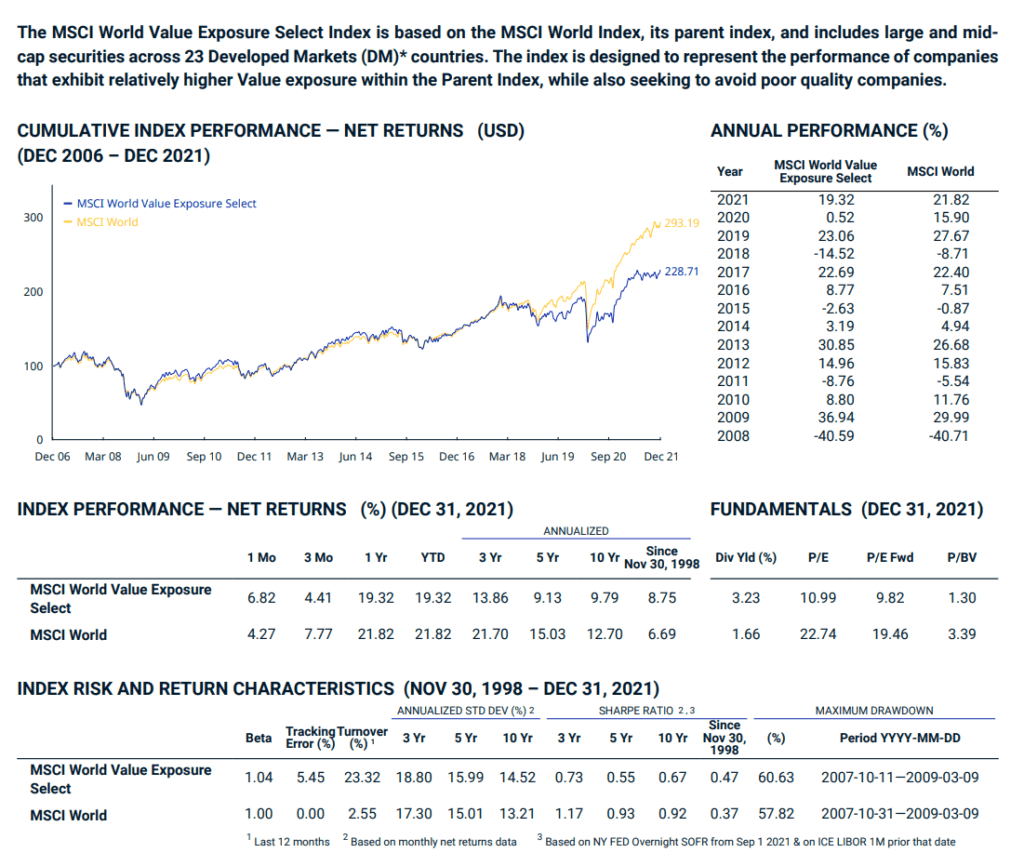
Compared to the Enhanced Value, the Value Exposure Select has a smaller outperformance if we compare back to inception.
But if we compare for the last 10 years, the Value Exposure Select did 9.8% while the Enhanced value did 8.99%.
There is a slight improvement and honestly, my research has not taken me to find out if eliminating poor quality improves the performance over more time periods and other markets.
But there is research that shows value and high quality is a good mix.
SPDR® MSCI Europe Value UCITS ETF (Ticker: EVAL)
EVAL is similar to WVAL but the main difference is that it covers Europe.
Here are some details about the EVAL:
- Provider: State Street
- Index Tracked: MSCI Europe Value Exposure Select Index
- The index drills down MSCI Europe
- Denominated in: EUR
- Domicile: Ireland
- Rebalances: Every half a year.
- Number of holdings: 126
- Expense ratio: 0.2%
- Current PE: 9.5
- Current PTB: 1.3
- AUM: 54 million EUR
- Incepted: Sep 2020
- Link to EVAL ETF
- Link to Index Methodology
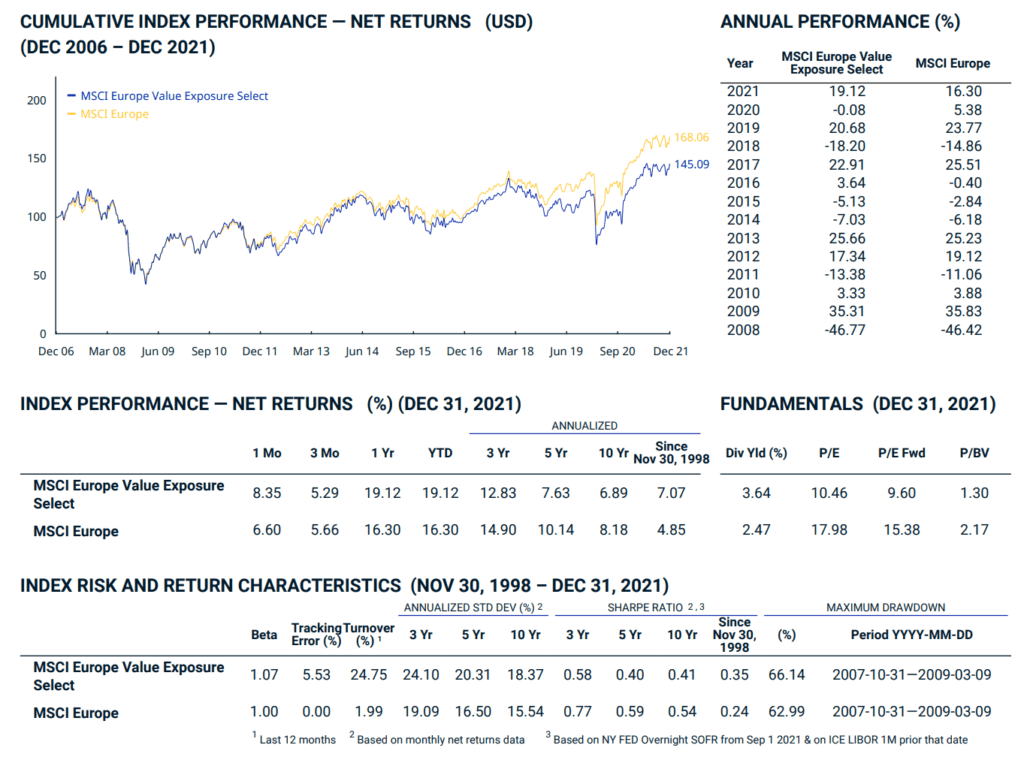
In terms of performance, there aren’t a lot of big differences between the Value Exposure Select implementation and Enhanced Value implementation. In fact, the value indexes performance both looks very close to MSCI Europe, which makes me wonder maybe there isn’t that much difference for European large-cap stocks.
SPDR® MSCI USA Value UCITS ETF (Ticker: USVL)
USVL is similar to both WVAL and EVAL.
This is the USA version that gives you exposure to the Value Exposure Select Index:
- Provider: State Street
- Index Tracked: MSCI USA Value Exposure Select Index
- The index drills down MSCI USA
- Denominated in: USD
- Domicile: Ireland
- Rebalances: Every half a year.
- Number of holdings: 124
- Expense ratio: 0.2%
- Current PE: 11.16
- Current PTB: 2.07
- AUM: 238 million
- Incepted: Feb 2015
- Link to USVL ETF
- Link to Index Methodology
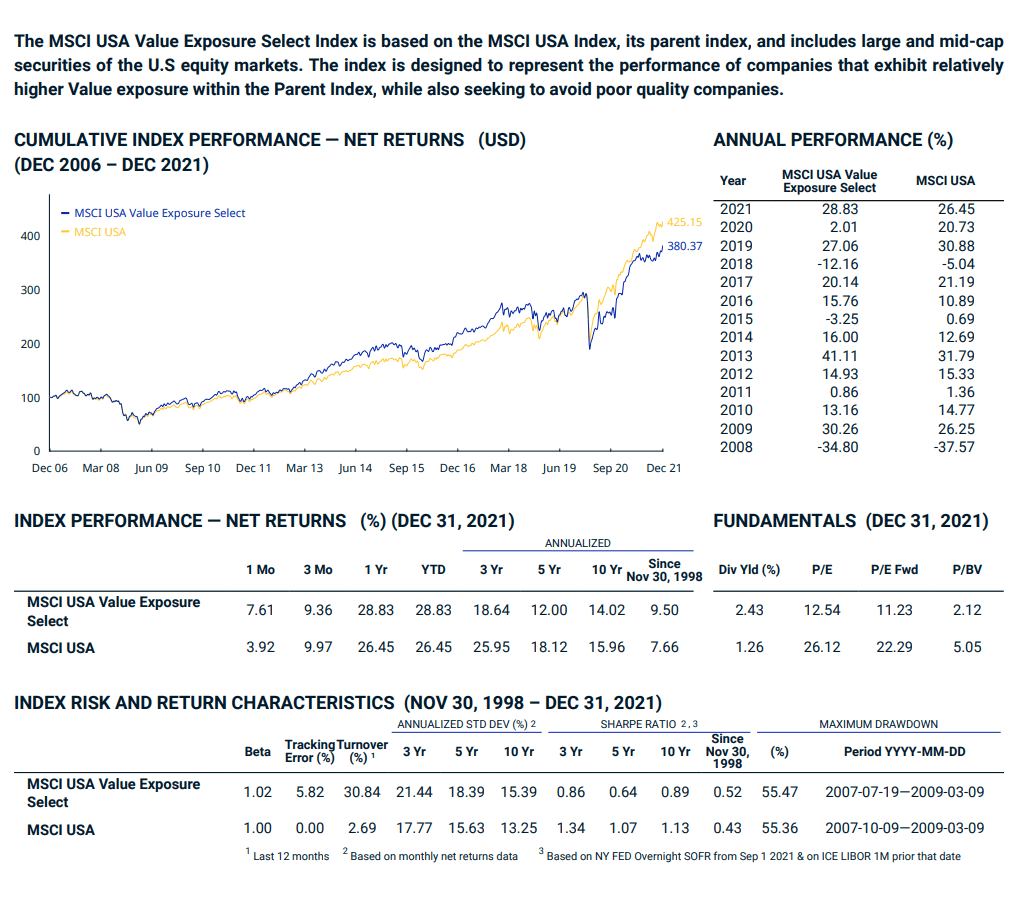
USVL is interesting in that, unlike the WVAL and EVAL, it actually did pretty well until COVID.
But looks can be rather deceiving because over 5-year, 10-year and since inception, the Enhanced Value actually did better.
I did a comparison of the two ETFs (USVL and IUVL) since 2017 and the performances are rather similar.
SPDR® MSCI USA Small Cap Value Weighted UCITS ETF (Ticker: USSC)
If you get to this point, you would realize that almost all the options are large-cap stocks. But if you want a small-cap option, it is rather limited.
There is one option in USSC.
USSC gives you exposure to small-cap US companies in a unique way:
- Provider: State Street
- Index Tracked: MSCI USA Small Cap Value Weighted Index
- The index drills down MSCI USA Small Cap
- Denominated in: USD
- Domicile: Ireland
- Rebalances: Every half a year.
- Number of holdings: 1935
- Expense ratio: 0.3%
- Current PE: 18.34
- Current PTB: 1.71
- AUM: 314 million
- Incepted: Feb 2015
- Link to USSC ETF
- Link to Methodology
At first glance, the price-earnings and price-to-book do not look cheap. The forward price-earnings is closer to 13 times.
USSC is not really a value ETF based on the normal value methodology. In most value methodologies, the stocks are ranked based on value metrics such as Price-to-book, Price-to-cash-flow, Price-earnings etc.
USSC weigh the stocks in the MSCI Small Cap USA universe based on an average of:
- Book value
- Average of previous 3 years end of fiscal year sales
- Average of previous 3 years end of fiscal year earnings
- Average of previous 3 years end of fiscal year cash earnings
So what you will get is a portfolio that puts more weight on companies with more sales, earnings and cash-earnings and book value.
The book value one look a bit odd if weights the companies with the highest book value. I would think it weights the companies with the smallest book value.
The price-earnings seemed higher may be because the companies with more sales, earnings and earnings cash flow tend to be more expensive.
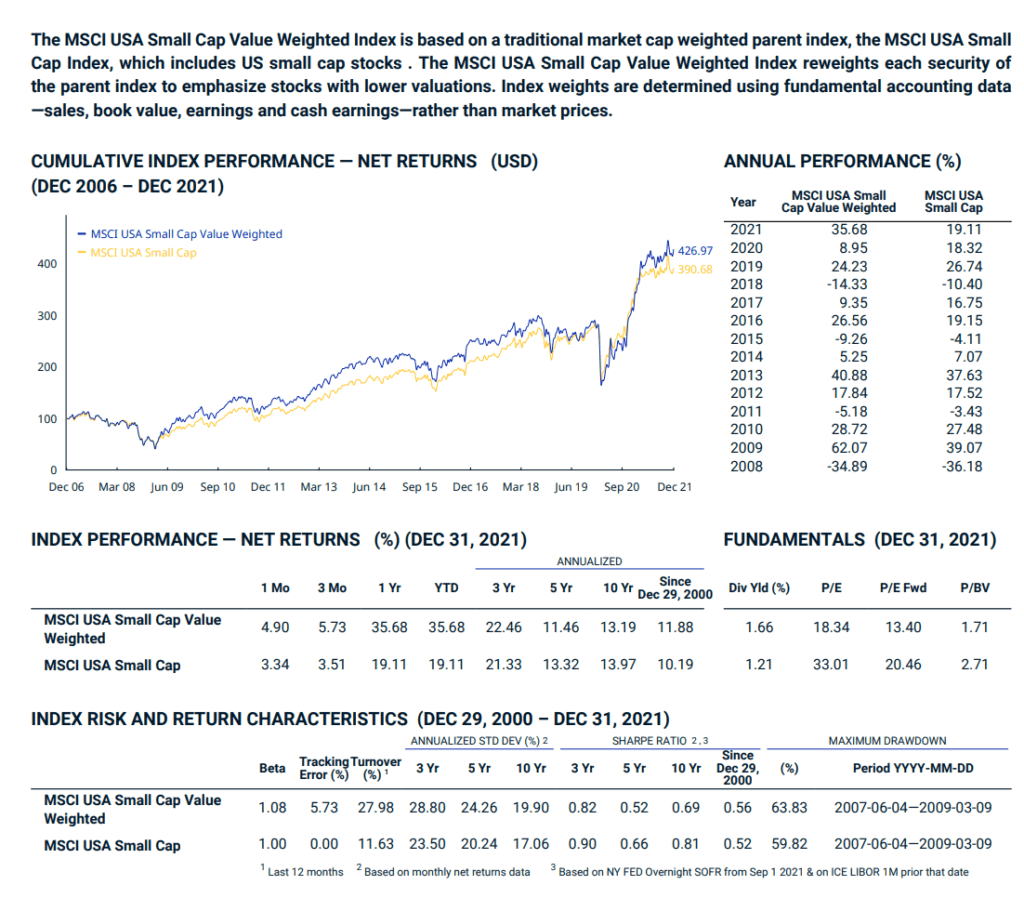
If we observe the 5-year, 10-year and returns since the index inception, the performance is quite close to the MSCI USA Small Cap index.
Last year was an exceptionally good year. The small-cap index performance lags behind the large-cap but if you believe that earnings, cash-earnings is going to matter more in the future, and small-caps is going to do better in an inflationary period, then USSC may be something to look at.
UCITS Sector ETFs Tilted Towards Value
Some investors wish to be more surgical in their approach to having a more value tilt or sector tilt towards their portfolio.
State Street has a stable of ETFs that allows you to target different MSCI World Sectors.
If you weight by earnings and cashflow-like value metrics you would typically get the following sectors:
- Information technology
- Financials
- Consumer Discretionary
- Healthcare
- Industrials
If you weigh more by price-to-book you will get
- Materials
- Energy
Since I have a premium Validea subscription, Validea lets me know the most valuable sectors right now and they are:
- Financial
- Materials
- Consumer Discretionary
- Energy
- Health Care
Here are the ETFs that allow you to target individual sectors:
| ETF | Ticker | AUM (mil) | PE | PTB |
| SPDR® MSCI World Communication Services UCITS ETF | WTEL | $28 | 18.5 | 3.4 |
| SPDR® MSCI World Consumer Discretionary UCITS ETF | WCOD | $40 | 25.8 | 4.4 |
| SPDR® MSCI World Consumer Staples UCITS ETF | WCOS | $86 | 22 | 4.4 |
| SPDR® MSCI World Energy UCITS ETF | WNRG | $491 | 12.5 | 1.7 |
| SPDR® MSCI World Financials UCITS ETF | WFIN | $502 | 12.4 | 1.4 |
| SPDR® MSCI World Health Care UCITS ETF | WHEA | $483 | 18.6 | 4.6 |
| SPDR® MSCI World Industrials UCITS ETF | WNDU | $78 | 20.7 | 3.6 |
| SPDR® MSCI World Materials UCITS ETF | WMAT | $111 | 12.4 | 2.4 |
| SPDR® MSCI World Technology UCITS ETF | WTEC | $471 | 29 | 9.5 |
| SPDR® MSCI World Utilities UCITS ETF | WUTI | $15 | 19.7 | 2.1 |
You can tell from the AUM which are the popular and useful ETFs! The ETFs with higher AUM are either technology or those that have lower PE.
I think if you wish to target the value sectors, you could only do it for the sectors where the majority of the companies have low PE or low PTB.
These are energy, financials, materials.
State Street have the following sectors for both Europe and the US individually. So there are many sectors for you to work with.
If you want to trade these stocks I mentioned, you can open an account with Interactive Brokers. Interactive Brokers is the leading low-cost and efficient broker I use and trust to invest & trade my holdings in Singapore, the United States, London Stock Exchange and Hong Kong Stock Exchange. They allow you to trade stocks, ETFs, options, futures, forex, bonds and funds worldwide from a single integrated account.
You can read more about my thoughts about Interactive Brokers in this Interactive Brokers Deep Dive Series, starting with how to create & fund your Interactive Brokers account easily.
I do have a few other data-driven Index ETF articles. These are suitable if you are interested in constructing a low-cost, well-diversified, passive portfolio.
You can check them out here:
- IWDA vs VWRA – Are Significant Performance Differences Between the Two Low-Cost ETFs?
- The Beauty of High Yield Bond Funds – What the Data Tells Us
- Searching for Higher Yield in Emerging Market Bonds
- The performance of investing in stocks that can Grow their Dividends for 7/10 years
- Should We Add MSCI World Small-Cap ETF (WSML) to Our Passive Portfolio?
- Review of the LionGlobal Infinity Global – A MSCI World Unit Trust Available for CPF OA Investment
- 222 Years of 60/40 Portfolio Shows Us Balanced Portfolio Corrections are Pretty Mild
- Actively managed funds versus Passive Peers Over the Longer Run – Data
- International Stocks vs the USA before 2010 – Data
- S&P 500 Index vs MSCI World Index Performance Differences Over One and Ten Year Periods – Data
Here are some supplements to sharpen your edge on low-cost, passive ETF investing:
Those who wish to set up their portfolio to capture better returns believe that certain factors such as value, size, quality, momentum and low volatility would do well over time and are willing to harvest these factors through ETFs and funds over time, here are some articles to get you started on factor investing passively:
- Introduction to factor investing / Smart Beta investing.
- IFSW – The iShares MSCI World Multi-factor ETF
- IWMO – The iShares MSCI World Momentum ETF
- GGRA – The WisdomTree Global Quality Dividend Growth UCITS ETF
- Investing in companies with strong economic moats through MOAT and GOAT.
- Robeco’s research into 151 years of Low Volatility Factor – Market returns with lower volatility that did well in different market regimes
- JPGL vs IFSW vs Dimensional Global Core vs SWDA – 22 years of 5-year and 10-year Rolling Returns Performance Comparison
- 98 Years of Data Shows the US Small Cap Value Premium over S&P 500
- 42 Years of data shows that Europe Small Cap Value premium over MSCI Europe
- My Dividend Experience Investing in UCITS iShares iBond Maturing in 2028. - April 23, 2024
- We Invest into Popular Funds When They Are Popular, Exactly When They Started Turning to Shxt. - April 22, 2024
- Meal Prep 2.0 – Cooking Your “Go-to” Meal that You Look Forward to Eating Everyday. - April 21, 2024

J
Sunday 9th of January 2022
Hi Keith, great article as usual. I am currently investing in VWRA and Dimensional funds (Global core equity and EM large cap). The 1st one is for a market capitalisation passive approach, while the 2nd one is for a factor-based active approach. I am wondering whether IWVL - which I see as a value-based passive approach, will have a place in my portfolio? Or do you think I have already covered the IWVL approach by investing in Dimensional funds? Thanks in advance for the advice.
Kyith
Saturday 15th of January 2022
Your Dimensional funds is a multifactor approach and by and large, it has elements of the value factor. It is just that IWVL's approach to value is a little different from Dimensional in that it is less price to book and using a more composite value approach. If you wish for something pure large cap world value and less dealing with profitability or focus on smaller large caps then having a little element of IWVL is not bad. But honestly i think you would not missed out on much.