In the past 17 trading sessions, we saw dramatic breakdowns in Singapore REITs’ prices.
Here is the price chart of Keppel Pacific Oak (ticker: CMOU):
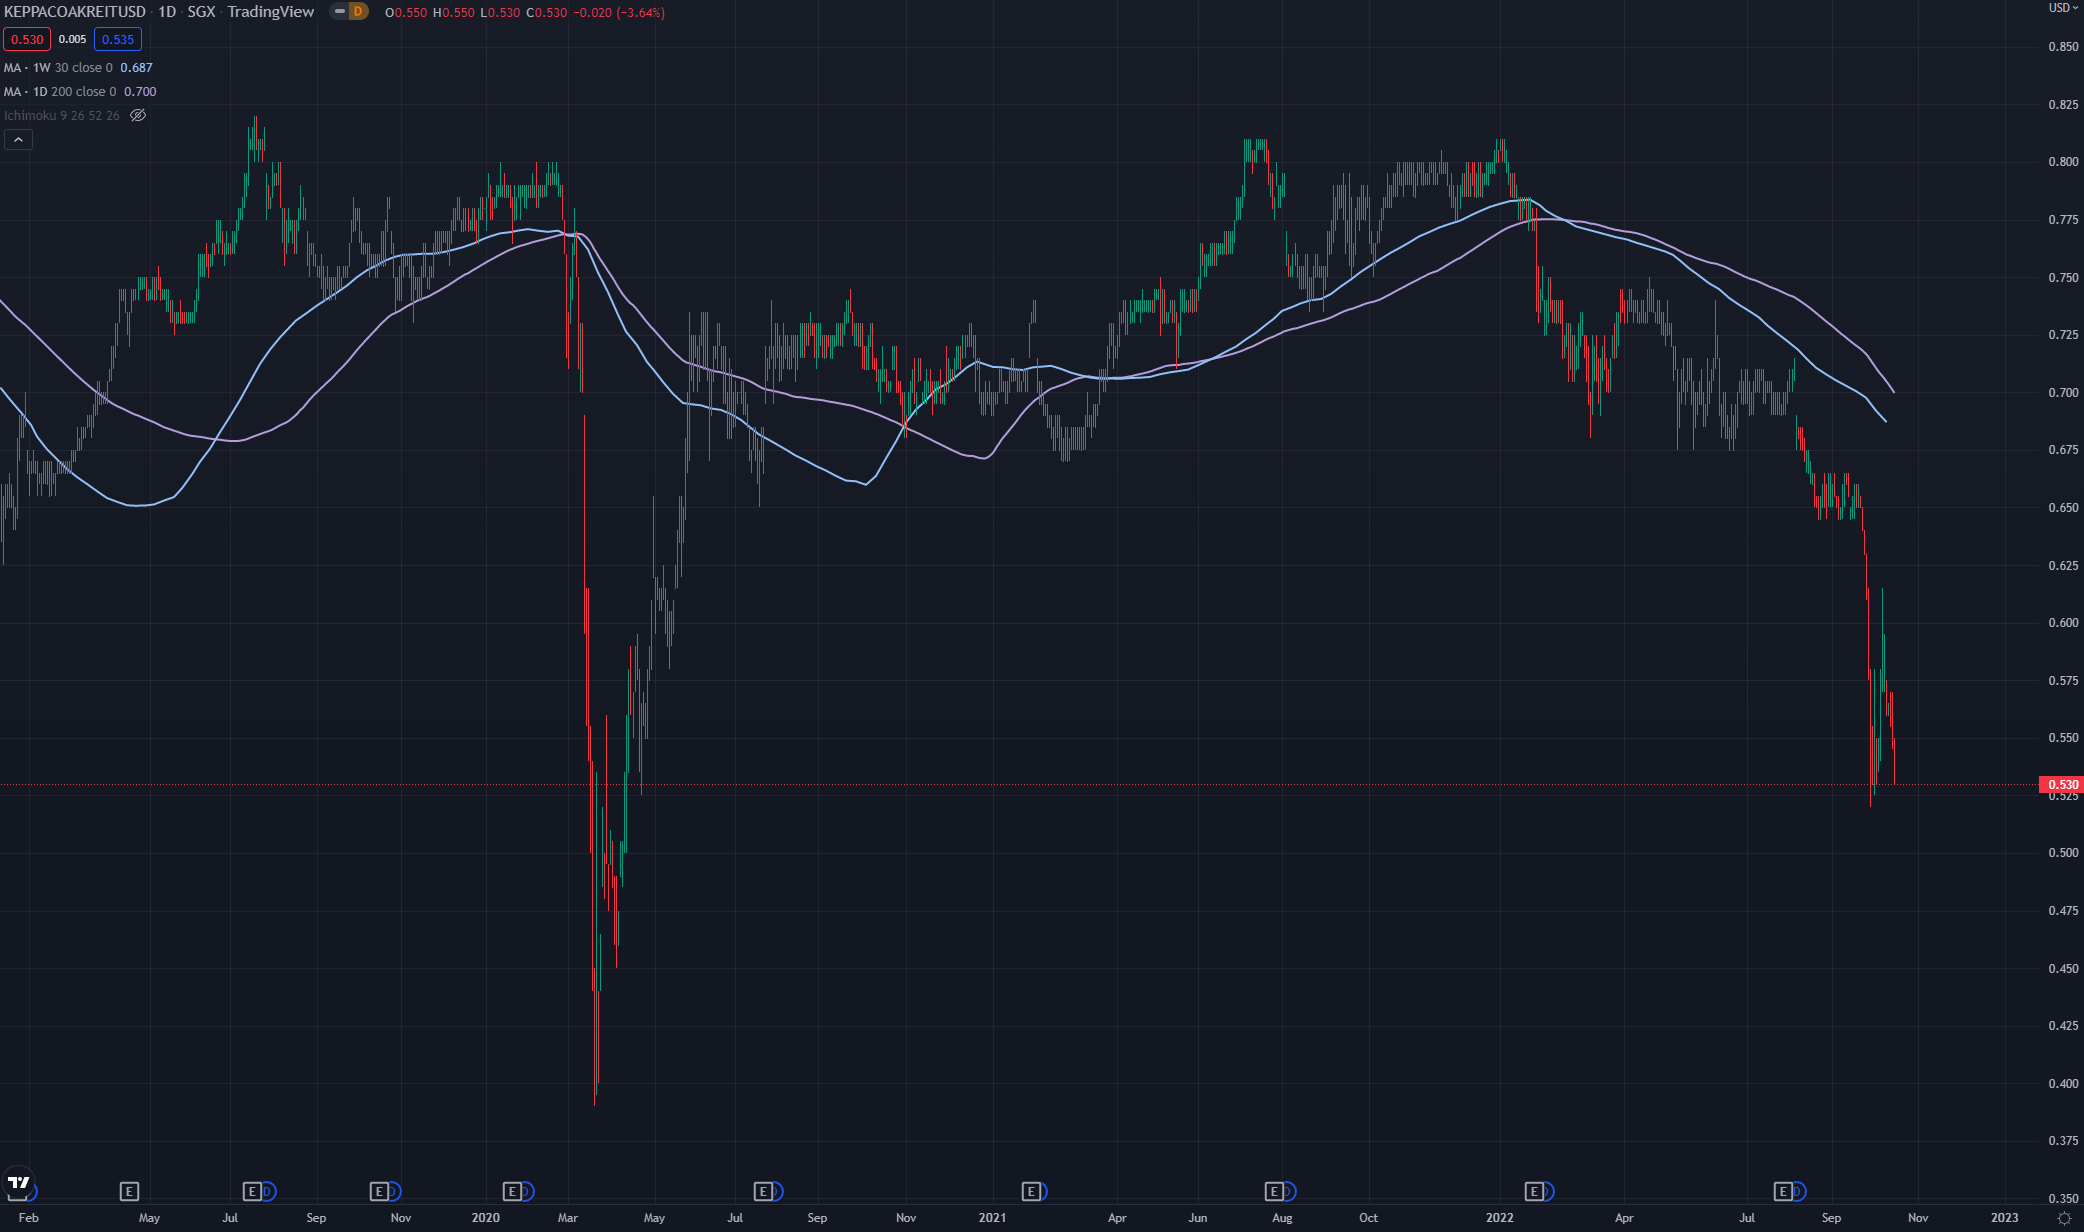
This kind of price movement feels more like some sort of margin call to leverage investors of high-yielding Singapore REITs, but it turns out this is not unique to Keppel Pacific Oak.
Here is the price chart of Vanguard Real Estate ETF (ticker: VNQ) in the US:

The last 17 trading session of VNQ has not been glorious either.
The glaring similarity between REITs in both regions is that risk-free rates are rising, but they have been rising for some time. Most likely, the market is pricing in that the risk-free rate will end up much higher and be higher over a more extended period.
With this price correction, I wonder if some of these REITs have corrected to a more reasonable valuation. I think other investors may be wondering the same thing as well.
REIT investing is not my game anymore, but I think I can still share a little about how you can fundamentally assess whether the current prices have priced in the potential secular shift in the market dynamics.
This may help you decide whether the specific REIT you are interested in are attractive or hasn’t priced in much of the risks.
Understanding the Importance of the Yield Spread
The price of the stock you see aggregates the future cash flow but also the collective sentiment of the market participants. Sometimes the participants got it right, and other times, the participants were too optimistic/pessimistic. They also argue over different timeframes.
While participants debate the prices, your job as a fundamental-based investor is to determine if the stock’s value leans closer to cheap, expensive or fair.
One of the more popular REIT valuation metrics is the yield spread.
The yield spread is the difference between the dividend yield of a REIT/ group of REITs at a certain point minus the risk-free rate. Typically, the 10-year government bond rate is used as the risk-free rate.
If the yield spread is very narrow, it means the difference between the yield of a REIT and government bonds of reasonably long duration is small and that there is no premium for the risks you undertake by investing in a REIT or a group of REIT. This indicates potentially greater relative overvalueness.
If the yield spread is extensive, it may indicate that too much risk is priced into the REIT and that the actual realized risk might be less than what the price indicates. This indicates potentially undervalueness.
The chart below shows the historical yield spread for Singapore REITs from the inception of the first REIT till five months ago:
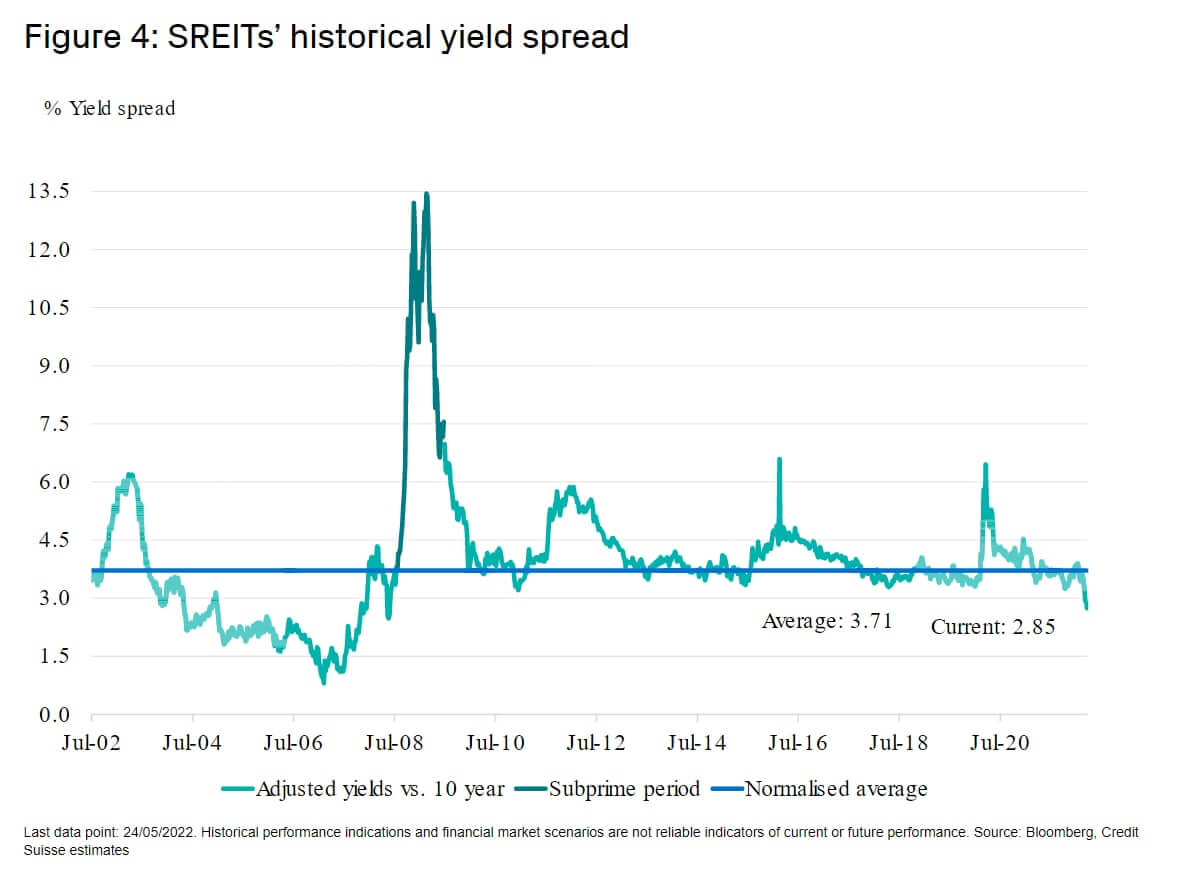
This chart is not very recent, but it is roughly enough to help us evaluate where we are. A yield spread chart calculates the difference between the yield of a basket of Singapore REITs and a risk-free rate, which I believe should be the 10-year Singapore government bond rate.
- If the dividend yield of Singapore REIT goes up, they are considered relatively more undervalued, all else equal.
- If the yield of the 10-year government bond rate goes up, then this spread narrows, meaning Singapore REIT is less attractive compared to high-quality, very low-risk bonds.
- The average yield spread is 3.7%.
- In past crises, the yield spread went cost to 6%.
- Yield spread can be used as a valuation metric, and valuation moves between undervaluing and overvaluing.
- The average yield spread is constantly moving. We won’t know what is the actual average until a long, long time. The Singapore REIT market has existed for only 20 years.
Given Where the Yield Spread is Currently, How Should You Invest?
How you invest will depend on your goal, which will defer from person to person. Generally, I would group the folks with different goals into these few groups:
- The long-term income investors
- The speculators
- Investors that actively manage their portfolio. REITs may be a position depending on the attractiveness
If you don’t know which group you belong to, the best action is to go back to the drawing board and get educated.
The speculators and those actively managing their portfolios may have the same playbook, but the timeframe differs. Those actively managing their portfolio may hold REITs for the income or their defensive nature relative to other kinds of stocks in their portfolio.
Speculators:
- Buy when the yield spread gets above 5% to 6%.
- REITs tend to be highly levered and often goes through panics when weak holders are forced to liquidate due to margin call. The high yield spread may not stay for long.
- During regular periods, some REITs go through their own problems and this yield spread can also be use as a meter of a reasonably attractive level.
Investors who actively manage their portfolio:
- During regular periods, some REITs go through their own problems, and this yield spread can also be use as a meter of a reasonably attractive level.
- When the yield spread is above 4%, treat it as an environment where you can consider if you want REITs in your portfolio. Valuation is reasonable, and you may be able to identify certain REITs that are mispriced (everyone trades at a low yield spread, but a particular REIT trades at a high yield spread).
- Yield spread above 4.5%, look for opportunities.
- Yield spread below 2.5%, might want to lighten up.
Long-term Income Investors:
- Try to buy when the yield spread is fair to attractive
- Have a portfolio of them that have reasonably good managers and have sanguine geographical and sectoral outlook
Whichever group try not to buy a REIT based on its prevailing dividend yield alone but its attractiveness relative to other investment options.
Some Similarities between Today and 2004 to 2007
We experienced our fair share of inflation in the 2000 to 2010 period. The long-term government yield then was 3%, which is not too far from today.
You can observe from the chart above how the yield spread narrows. That was a combination of:
- Valuation expansion (maybe due to lower risk as investors understand REITs better)
- Rising government yields
During that period, I think the yield spread compression is due more to #1.
This time round #2 is happening but we are facing a combination of:
- Economic slowdown (affecting retail, industrial, and hospitality)
- Secular trend changes (office)
- Negative news in the media
The path of least resistance seems to be some sort of valuation reset.
Valuation resets are not new and happen from time to time. It is just that it is painful for those who are currently invested.
High-Interest Rate Environment Didn’t Prevent US REITs From Doing Well in the 1970s
While rising risk-free rates affect REITs’ attractiveness, history shows other factors are at play besides REITs.
In my Learning to invest in REITs section, I bring to investors learning about REITs some data curated by Ben Carlson at A Wealth of Common Sense about REIT performance by decades:

Let’s just say that rates in the past were much higher than current, but observe that REIT performance is less correlated to where risk-free rates are at.
There are other factors at play which YOU must figure out.


The charts above show the REIT’s relationship with bonds and stocks over history. The hypothesis is that since REITs are interest rate sensitive and bonds are also interest rate sensitive, and their 5-year correlation should be pretty close. From the graph above, there are times that the correlation is high (closer to 1), but there were also times when they are negatively (negative number) or low (less than 0.5) correlation. The correlation with equity is higher, but even then, the correlation also changes over time.
If the correlation between bonds and REITs is so uneven, what does this mean for investors?
Valuation definitely is essential, but historical performance and correlation mean that other factors could work in favour or against REITs. We should not just decide to invest solely based on valuation.
Using Keppel Pacific Oak (KORE) as a Case Study to Access Whether the US Office REIT Trades at an Attractive Valuation.
Now that you understand a little about how to value a REIT or a group of REITs with the yield spread, how do we attempt to determine if a REIT trades at an attractive valuation?
It may be easier to use a REIT as an example to determine whether the REIT currently trades attractively. I decide to use Keppel Pacific Oak (because I have no idea why it pops into my head).
Fundamentally, a change in interest rate affects a REIT like KORE by:
- Possibly shifting the demand and supply dynamics for the better/worse/unchanged
- Increasing the interest expense for the REIT
The demand and supply dynamics may remain favourable in some climates, but it may be challenging to rent out well in another climate.
The following slide shows the profile of the lease expiry of KORE’s properties:

Every year, 12-16% of the leases in KORE’s property are near expiry and need to be renewed, but we are unsure if the escalation is positive or negative.
We can assume that the negative and positive escalation cancel out and revenue remains flat to remain conservative.
Typically, leases on US property build in yearly rental escalation but based on accrual accounting, this escalation should have been smoothed out in the income statement.
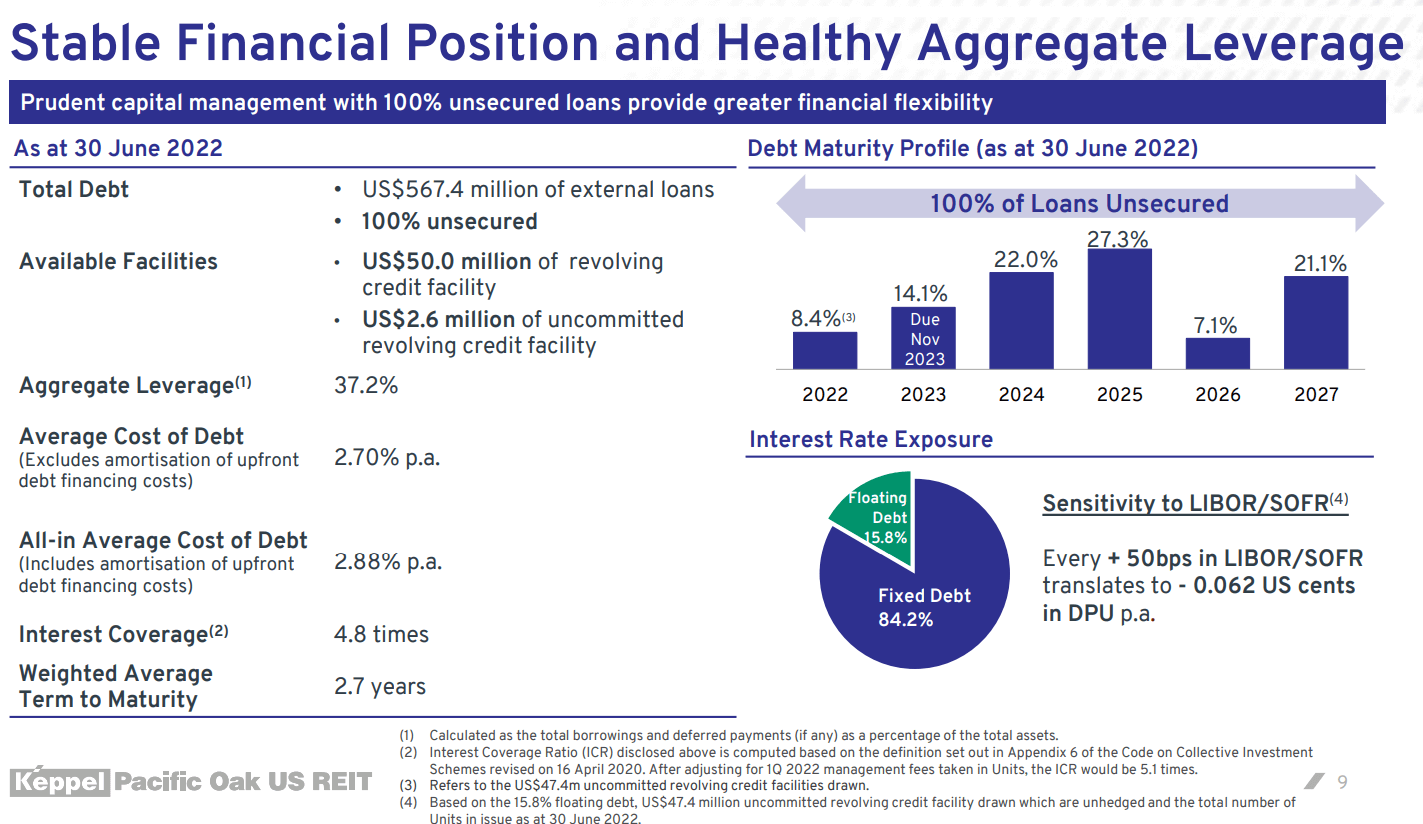
Here is the latest KORE balance sheet:
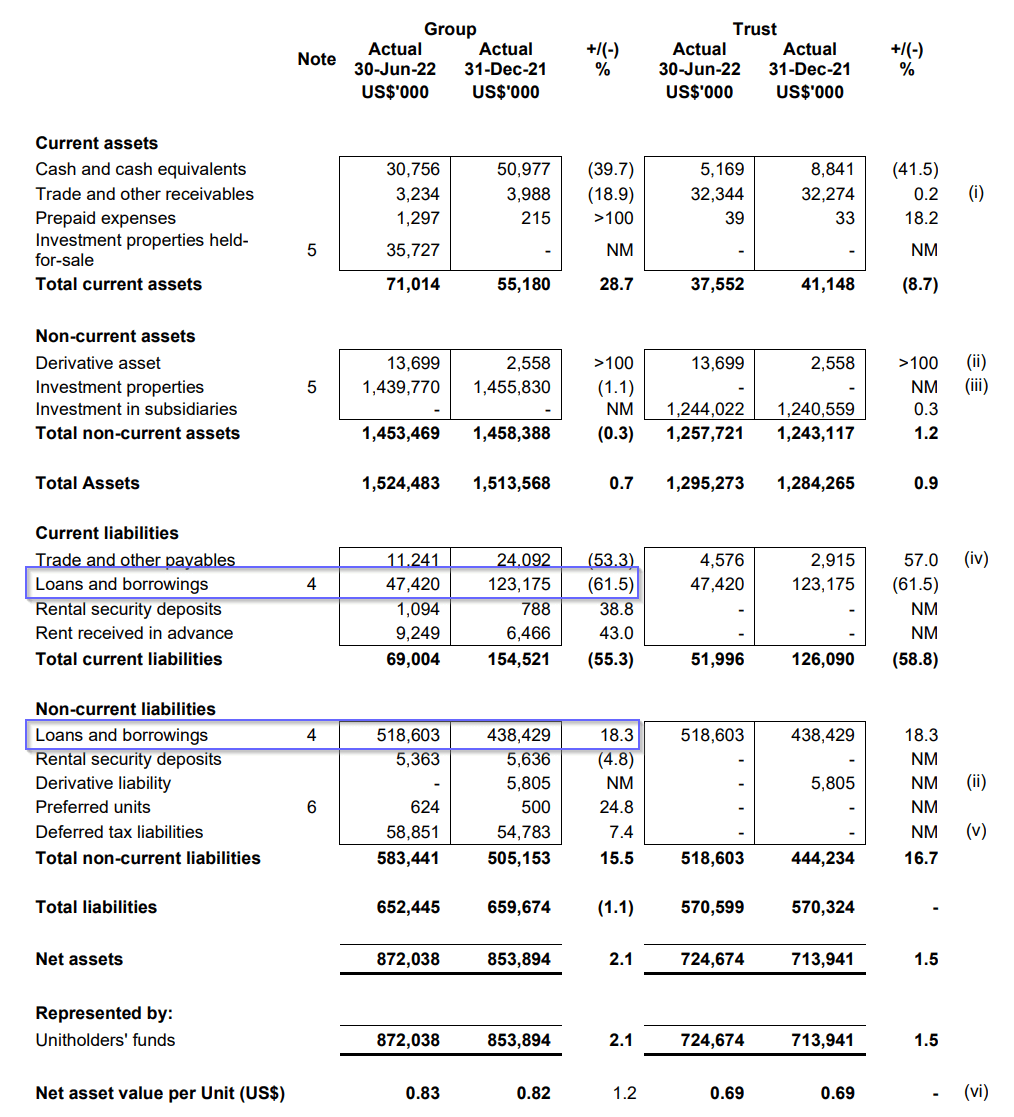
Currently, KORE has $47 mil + $518.6 mil = $565.6 mil in outstanding debt.
Here is KORE’s income statement:
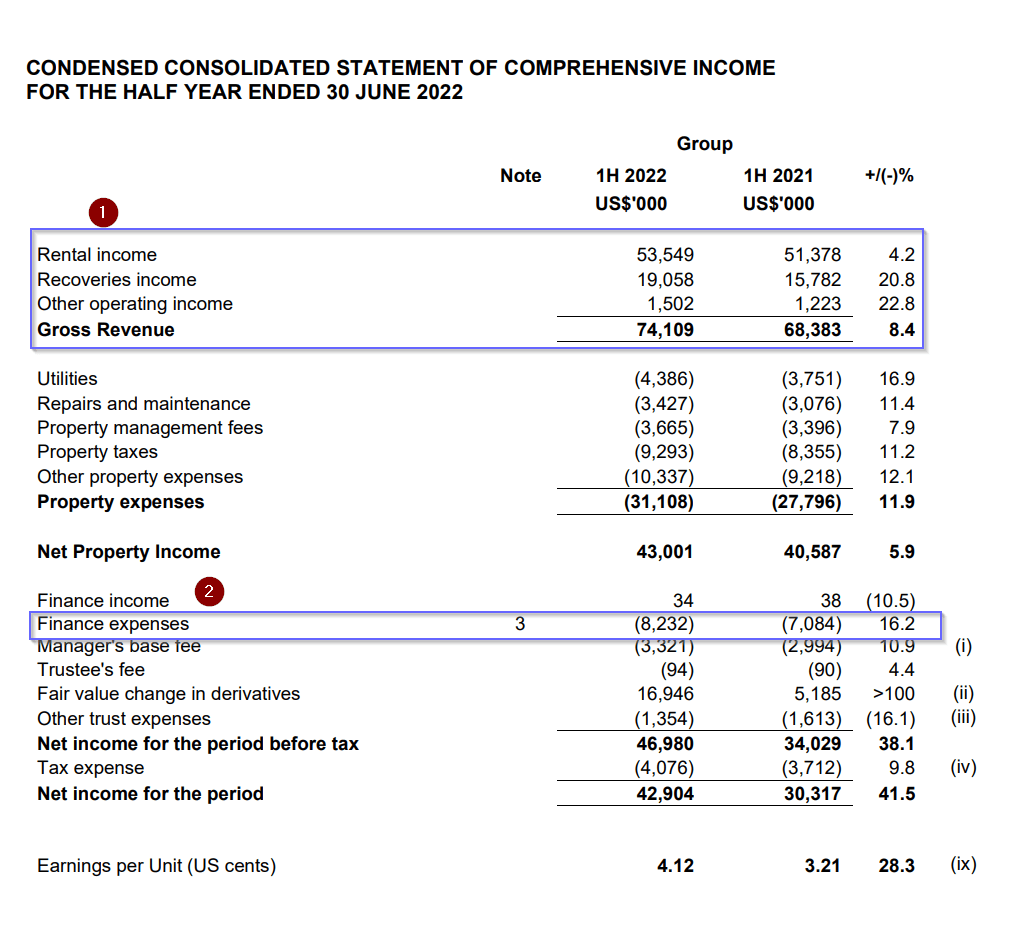
We can assume the revenue factors in any built-in rental escalation, and if we also assume revenue to be flat (conservatively), then the gross revenue should not change.
Finance expenses work out to be an annualized $8.2 mil x 2 = $16.4 mil.
Typically, most REITs will present the following distribution adjustment to mediate the differences between the income for the period and the income that is available to pay out to REIT unit holders:
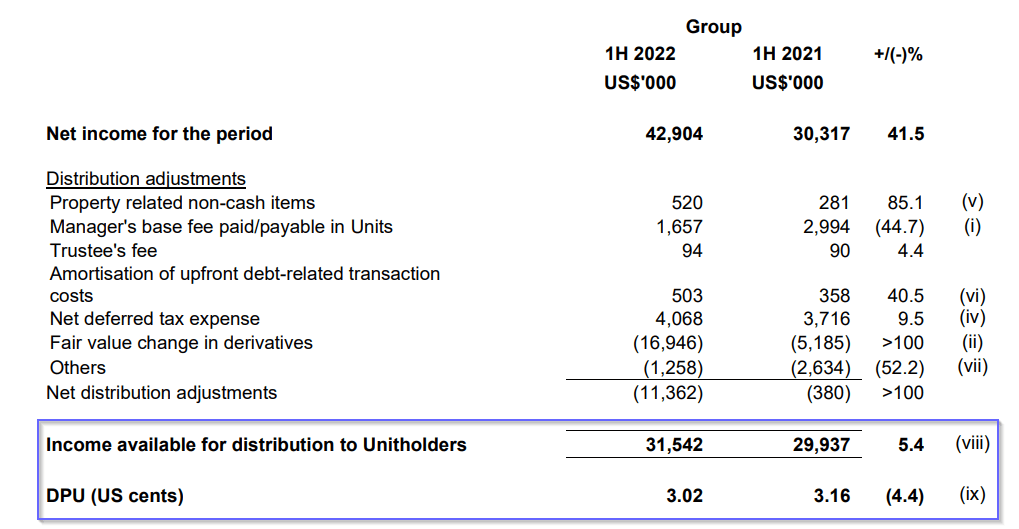
We do not see many adjustments in the distribution adjustment summary due to interest expense changes.
What is the finance cost as a percentage of debt on the income statement?
If we take $16.4 mil divided by $565.6 mil in outstanding debt, we currently arrive at a finance cost of about 2.9% a year.
That 2.9% a year looks quite close to the 2.88% yearly all-in average cost of debt presented by KORE.
Estimating the longer-term impact of the higher cost of financing.
The stock market constantly tries to reprice the value of REITs like KORE with the new information that surfaces over time.
Most well-managed REITs have spread out the maturity of their debt such that maturity forms a ladder. In this way, only a portion of the debt matures, and the interest cost can be smoothed out over time.
We do not know the future, but we can make a conservative estimation if the REIT has to operate in a higher-interest environment.
We can estimate the all-in average cost of debt step up from 2.9% to:
- 4.4% (1.5% more)
- 4.9% (2.0% more)
- 5.4% (2.5% more)
Here is the impact of the annualized DPU:
- No change: 6.04 cents
- 4.4%: 5.20 cents
- 4.9%: 4.95 cents
- 5.4%: 4.68 cents
Using the last traded price of US$0.53 (14 Oct 2022), the dividend yield works out to be:
- No change: 11.4%
- 4.4%: 9.9%
- 4.9%: 9.3%
- 5.4%: 8.8%
Even with a long-term higher interest cost of 2.5% yearly, an 8.8% yearly dividend yield looks extremely attractive.
But what if we adjust for the current risk-free rate?
Calculate the yield spread over a risk-free rate for the forecasted dividend yield.
KORE is a REIT with a portfolio of US office buildings financed by US-denominated debt.
A more suitable risk-free rate would be the current 10-year US Government bond rate which is about 4.02%.
We can then calculate the yield spread for the different long-term all-in average costs of debt:
- No change: 7.4%
- 4.4%: 5.8%
- 4.9%: 5.3%
- 5.4%: 4.8%
If the all-in interest cost stabilized at 2.5% higher than today, the yield spread looks fair to undervalue.
But this could change if we assume that the longer-term US government bond rate will stabilize at 5% a year. Then, I would say KORE is trading at a fair valuation.
I think the 10-year government bond usually reflects the country’s longer-term growth, and I wonder if the US would grow at a long-term rate of 5% a year.
I find it hard to believe that rates will stay above 5% (but I could be wrong). 4% is quite a good baseline.
What have I not factored into this analysis?
A lot of other things!
I did zero analysis on the fundamental outlook of the office sector, occupancy outlook, management, etc.
If you decide to put a meaningful amount of money in (which most of us would), then an attractive valuation is just a screen to shortlist stocks to do more work.
Conclusion
To a large extent, valuation and investing are part science but also part art.
The market is constantly trying to price in new information, and with more information, what may be considered undervalued may suddenly be fair with new information.
There are a few variables at play here, such as risk-free rate, the ability to raise rents for different REIT segments and geographical regions, and many more.
You may feel more confident about the ability of some REITs to grow their topline in an environment where unemployment is low such that it negates the higher interest expense. If that is the case, then some REITs would look very favourable at the current price.
I gave some ideas. Hopefully, it helps you find what you are looking for.
I might just do the same thing for some of these REITs and publish the result as a post or on my Telegram channel.
If you want to trade these stocks I mentioned, you can open an account with Interactive Brokers. Interactive Brokers is the leading low-cost and efficient broker I use and trust to invest & trade my holdings in Singapore, the United States, London Stock Exchange and Hong Kong Stock Exchange. They allow you to trade stocks, ETFs, options, futures, forex, bonds and funds worldwide from a single integrated account.
You can read more about my thoughts about Interactive Brokers in this Interactive Brokers Deep Dive Series, starting with how to create & fund your Interactive Brokers account easily.
Kyith is the Owner and Sole Writer behind Investment Moats. Readers tune in to Investment Moats to learn and build stronger, firmer wealth foundations, how to have a Passive investment strategy, know more about investing in REITs and the nuts and bolts of Active Investing.
Readers also follow Kyith to learn how to plan well for Financial Security and Financial Independence.
Kyith worked as an IT operations engineer from 2004 to 2019. Currently, he works as a Senior Solutions Specialist in Insurance Start-up Havend. All opinions on Investment Moats are his own and does not represent the views of Providend.
You can view Kyith's current portfolio here, which uses his Free Google Stock Portfolio Tracker.
His investment broker of choice is Interactive Brokers, which allows him to invest in securities from different exchanges all over the world, at very low commission rates, without custodian fees, near spot currency rates.
You can read more about Kyith here.
- New 6-Month Singapore T-Bill Yield in Late-April 2024 to Drop to 3.70% (for the Singaporean Savers) - April 18, 2024
- Golden Nuggets from JPMorgan Guide to Retirement 2024. - April 16, 2024
- Be Less Reliant on Banks and Build Stronger Capital Markets by Pushing for Better Shareholder Dividend and Buyback Yield - April 14, 2024
MooMooCow
Saturday 22nd of October 2022
Hi Kyith. Nice post! Just wondering, why do you say REITs are no longer your game? Have you somehow shifted your investing preferences / style over the years? Apologies I follow your blog from time to time but I might have missed some of your updates as they pertain do your own personal investments :).