A reader of mine shared with us that he was having a drink with a friend.
His friend asked whether they are happy with how their life turned out currently. My reader said that we should feel happy if a few areas of our life turn out well.
So he proceed to draw up a series of circles and score 5 important areas of his life. These are family, career, friends, finance and health.
A score of 1 for him is excellent and 5 is very unimpressive.
So here is an example:
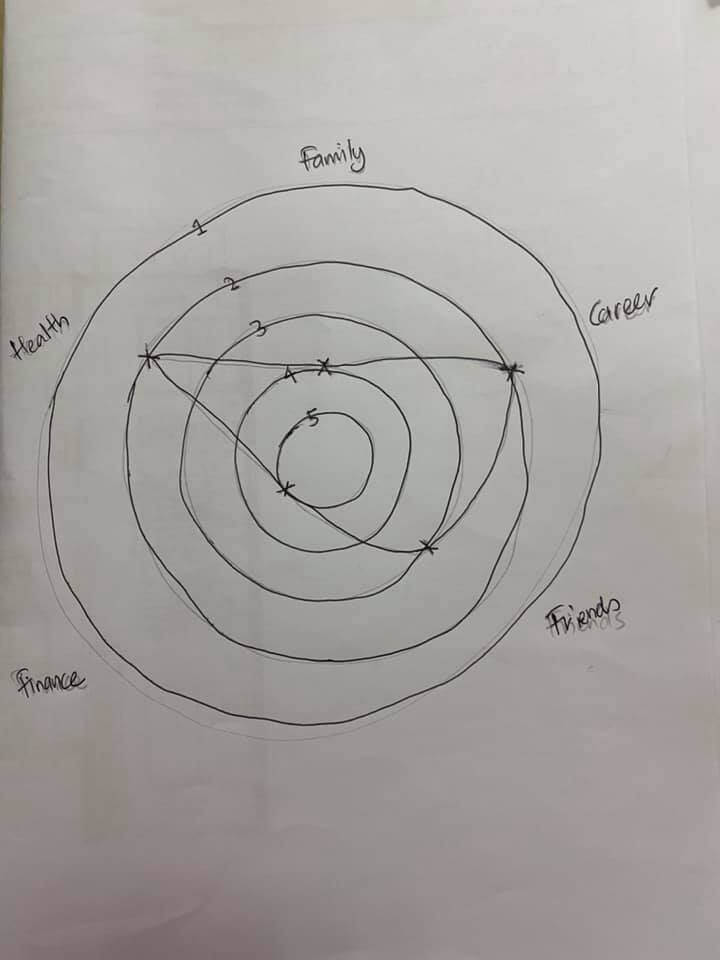

I give him props for drawing decent circles without a ruler.
Our success in many areas of life and work is determine by not just one thing but a few different things.
What my reader did was to come up with what Excel will call a radar chart. It allows us to review things through multiple variables that determines something.
The bigger the area, the better or worst the thing is. In this case, the bigger the area, the more happy you should be.
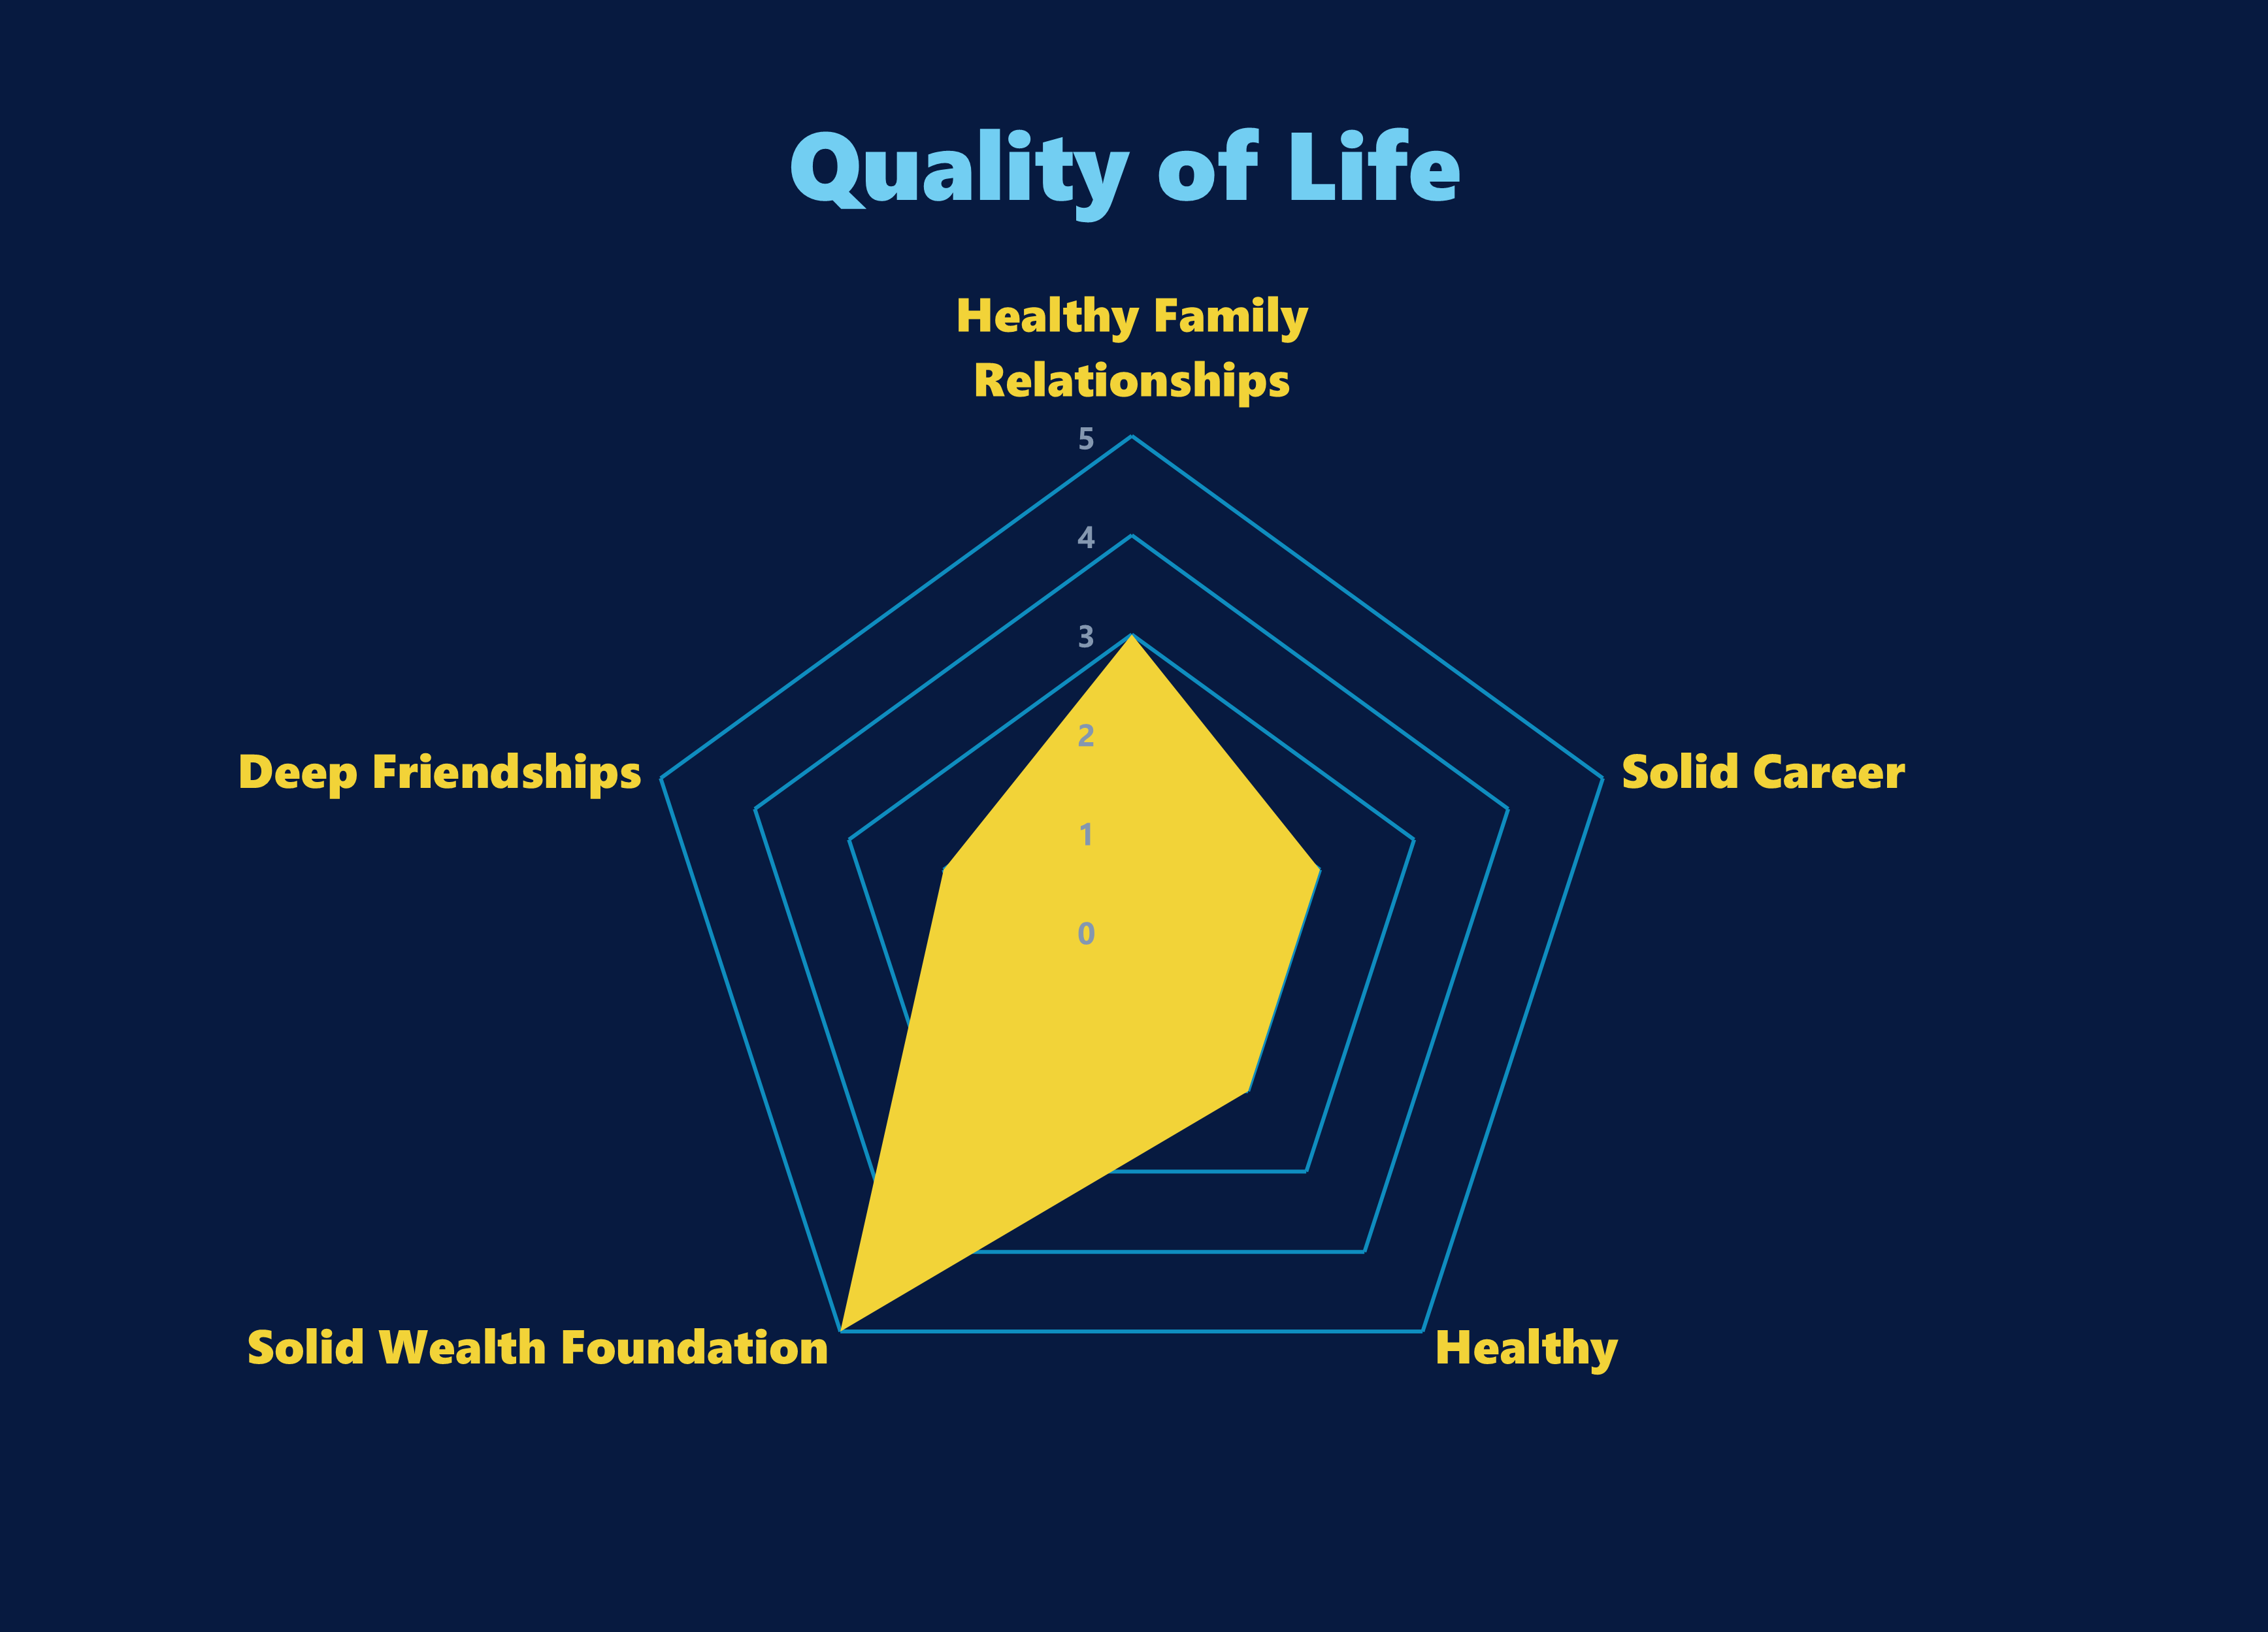
You can create something like the above in Microsoft Excel or Google Spreadsheet. I tried it with Google Spreadsheet but it does not allow me to format the labels at all. So I created the one above on Excel.
I do find that alot of the descriptions are pretty simple like what my reader did. I wonder if it is better to expand and describe what determines a good quality of life with one or two more words.
What does family mean? We probably want healthy family relationships. What about a career? Would that be that we want a lucrative career or solid career.
What about money? Do we want a lot of money or that we want a solid wealth foundation (which you can read my build a solid wealth foundation series)?
I think adding one or two words changes the discussion with your friends in a different way. We might not want a lot of money but perhaps financially secure.
Financial Strategies can be Evaluated with Radar Charts as Well
Very often, people look at things in a very binary manner: Good or not?
Like our quality of life, whether a strategy is good or not is determine by multiple aspects.
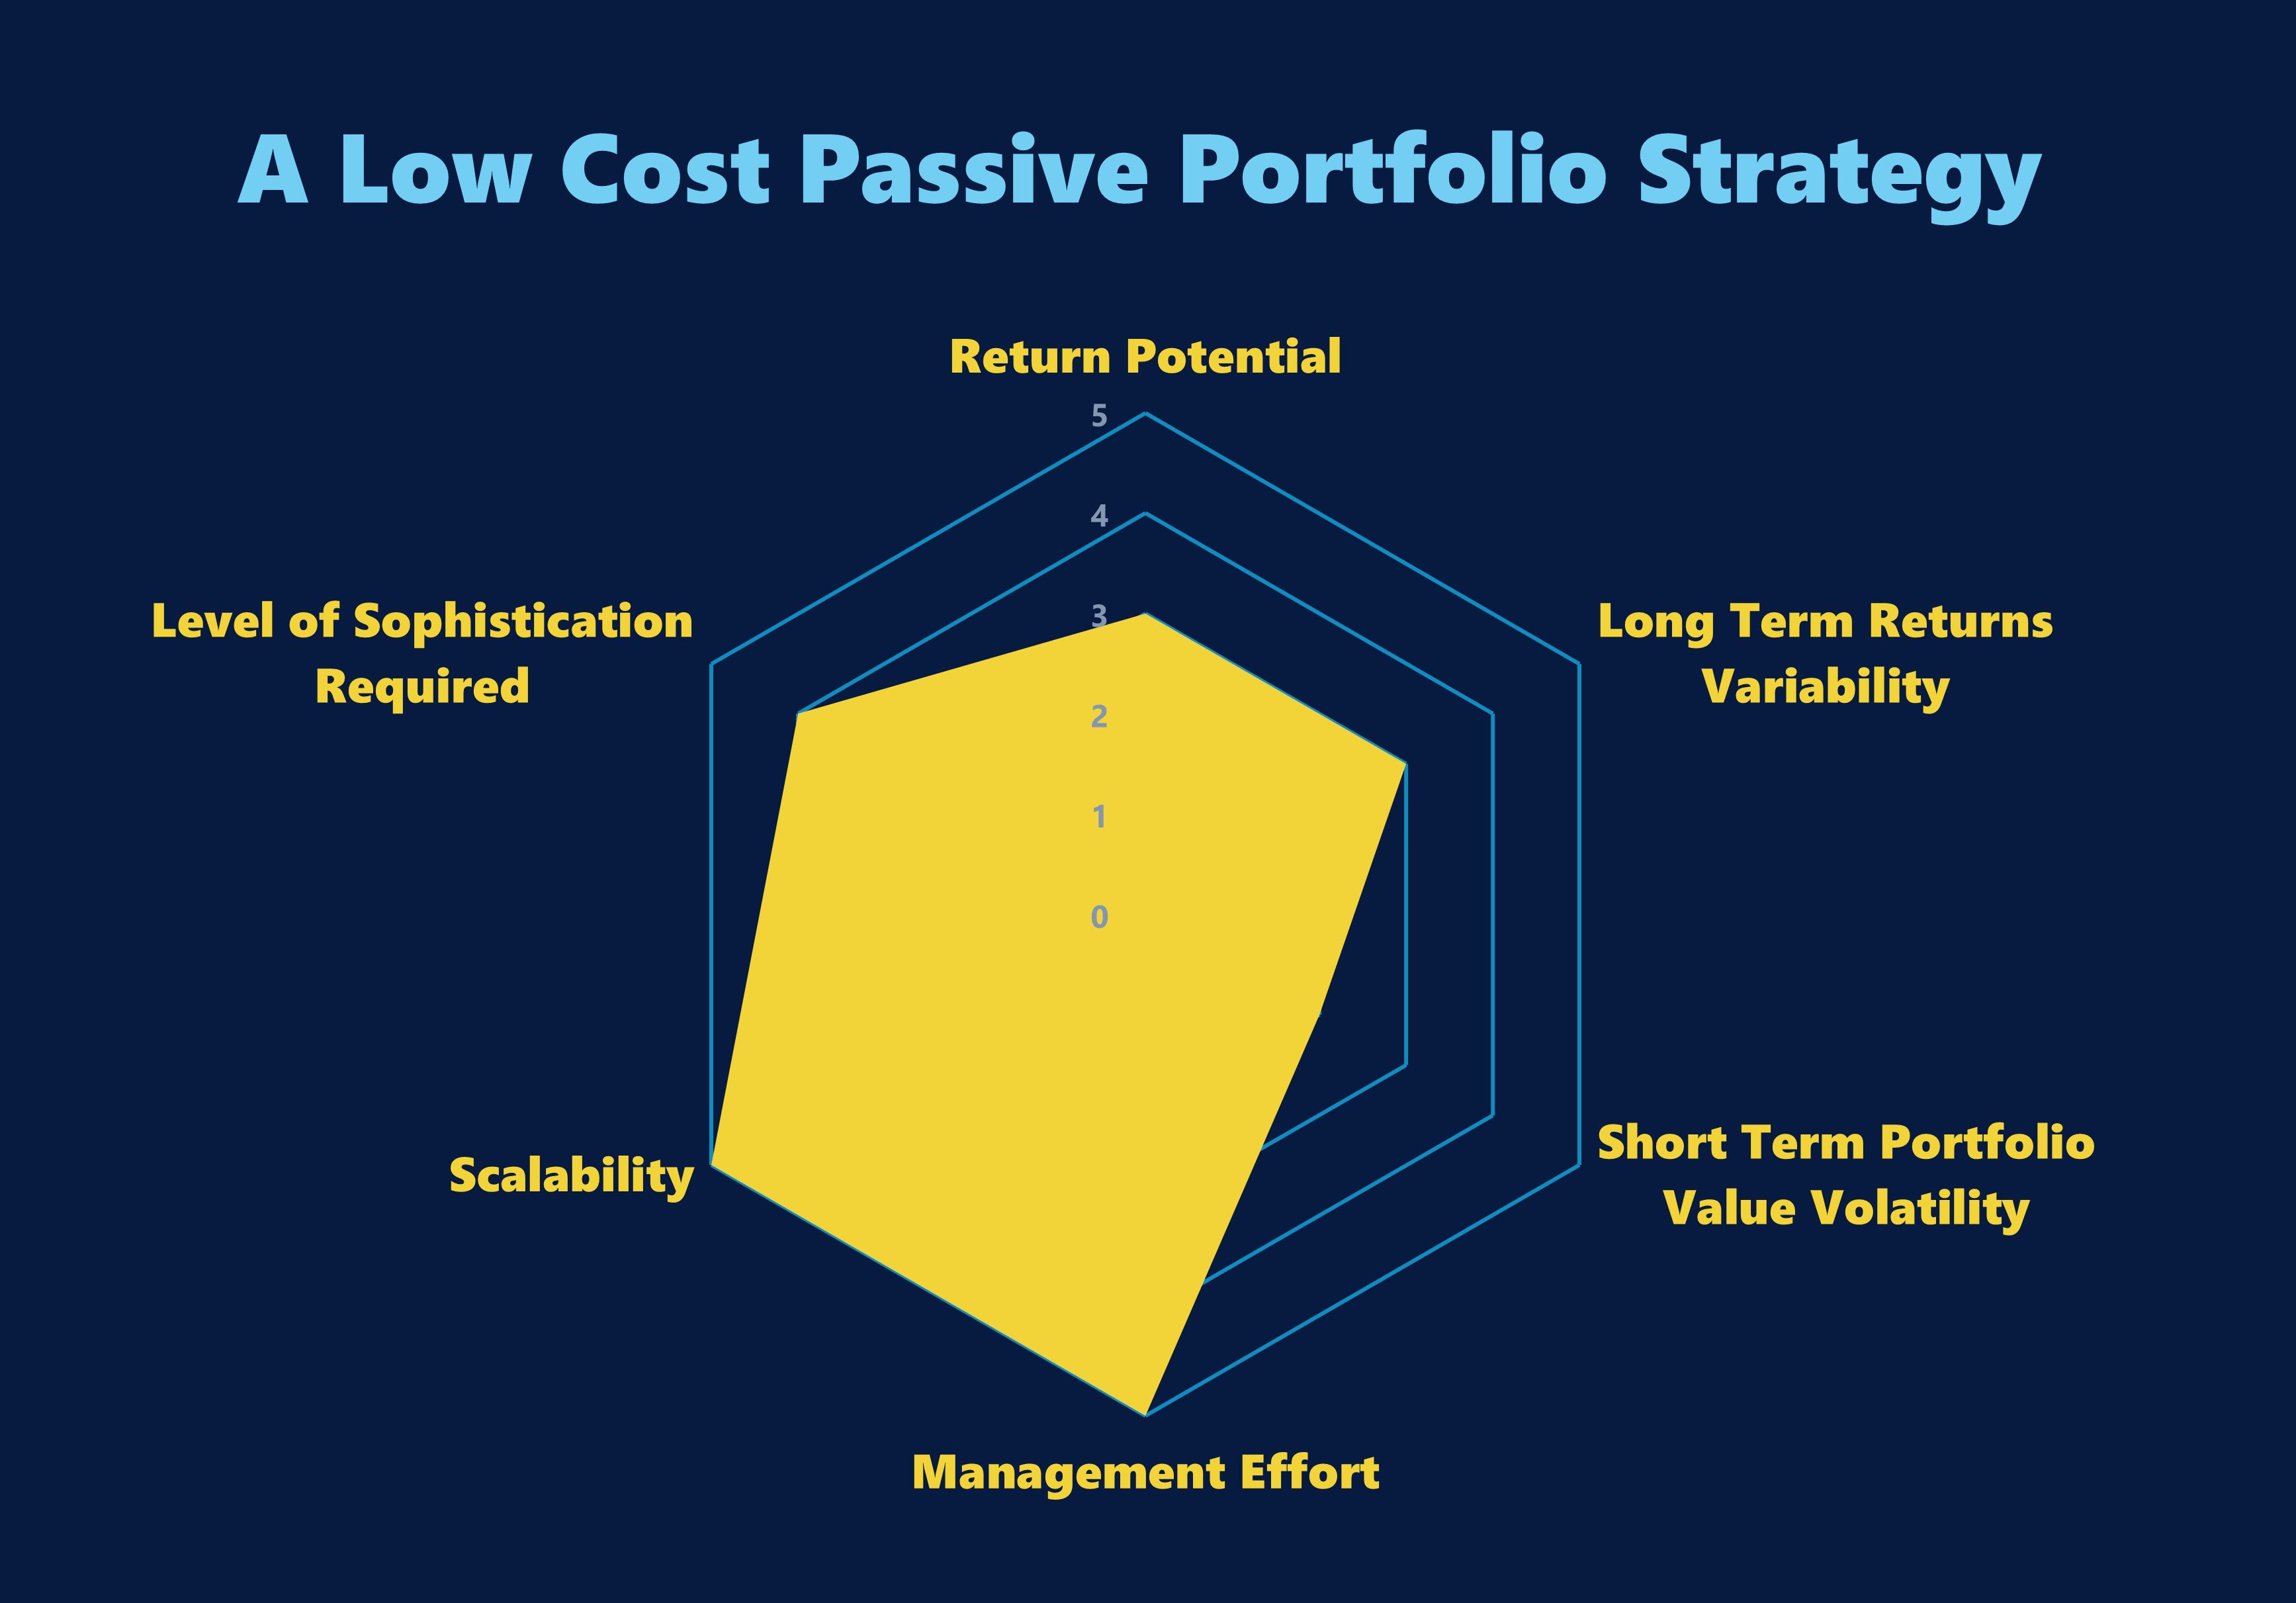
Take the case of a low cost, broadly diversified, equity and bond portfolio using exchange traded funds.
I think a 5-figure score is good enough for us to evaluate:
- Very low
- low
- medium
- high
- Very high
The exact descriptions will depend on the variable we are evaluating. In terms of investment strategy, these are the considerations that you should think about:
- Return potential. 5 means high returns potential based on your allocation. If you are in 100% bond allocation, the returns potential are limited.
- Long Term Returns Variability. 5 means long term returns are not so variable. For example, bond returns are pretty fixed in that they should track the risk-free rate. In comparison, the range of long term returns you will get from a 60/40 portfolio will depend on the starting market valuation versus the market valuation in the future, population growth and productivity. Some may get lower long term returns some may get higher.
- Short Term Portfolio Value Volatility. 5 means in the short term the portfolio volatility is low. Lower volatility is much more livable! For example, many prefer investing in residential property because the volatility is low. Property value doesn’t get evaluated so much like a stock which happens every day.
- Management Effort. 5 means very low effort. Management is basically very passive. You don’t have to spend effort screening for investments, evaluating investments, deciding to buy, sell and hold decisions so often.
- Scalability. 5 means very scalable. Whether you have $1000 or $10 million you can invest.
- Level of Sophistication Required. 5 means to build decent wealth, you do not need a lot of sophistication.
This low-cost strategy scores very well in scalability, low management effort and the level of sophistication required. The returns potential are average and you will get a range of long term returns.
The downside is that short term portfolio will be volatile.
If you evaluate things over multiple variables, you might find something that matches the stage of life you are in.
If you decide to manage your own concentrated, individual stocks portfolio, here maybe how I would see your strategy:
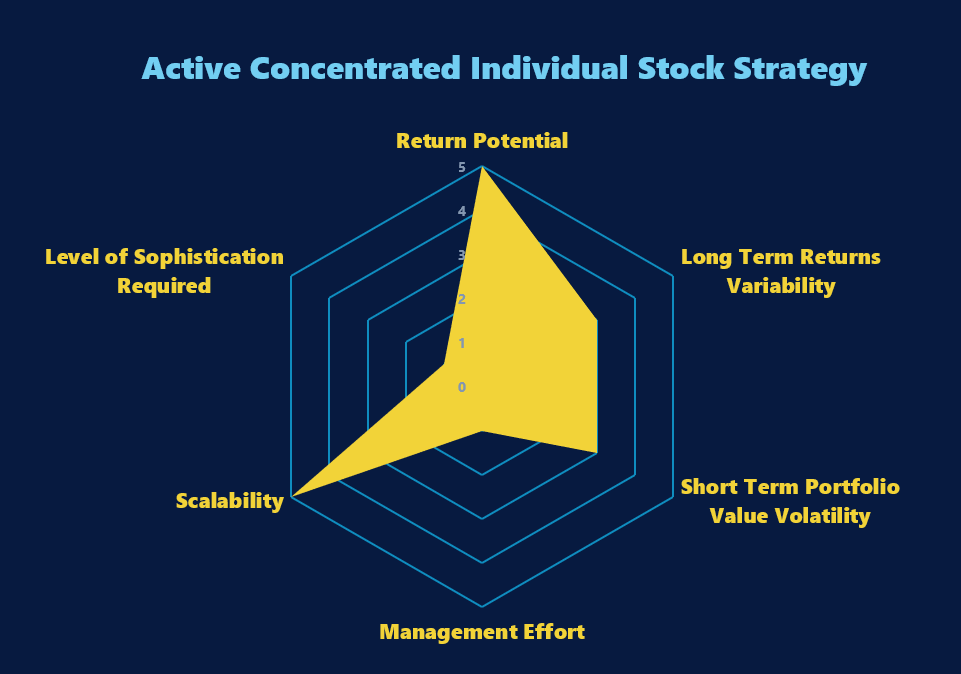
The returns potential is high if you manage to develop the sophistication. People earn 6% a year return you earn 15% a year over a long period. Whichever way, long term returns will still be variable. Some may get 5%, 8%, 23%, 18%.
For some who focus on less volatile stocks, they might be omre insulated from short term portfolio volatility. However, you cannot run away from that too much.
With liquid markets, most stock strategies are scalable, unless you prowl in the Singapore microcap space, where if your portfolio is too large, it might be challenging for you to do it.
The downside of this strategy is the level of sophistication required to do well is high and the general level of management is also high.
The returns potential may outweigh all factors, but another person might find value in the low cost, passive portfolio strategy because that is more compatible with their lives.
In any case, radar charts are pretty cool. If you have one that you use in your daily lives, feel free to share with me.
I invested in a diversified portfolio of exchange-traded funds (ETF) and stocks listed in the US, Hong Kong and London.
My preferred broker to trade and custodize my investments is Interactive Brokers. Interactive Brokers allow you to trade in the US, UK, Europe, Singapore, Hong Kong and many other markets. Options as well. There are no minimum monthly charges, very low forex fees for currency exchange, very low commissions for various markets.
To find out more visit Interactive Brokers today.
Join the Investment Moats Telegram channel here. I will share the materials, research, investment data, deals that I come across that enable me to run Investment Moats.


Do Like Me on Facebook. I share some tidbits that are not on the blog post there often. You can also choose to subscribe to my content via the email below.
I break down my resources according to these topics:
- Building Your Wealth Foundation – If you know and apply these simple financial concepts, your long term wealth should be pretty well managed. Find out what they are
- Active Investing – For active stock investors. My deeper thoughts from my stock investing experience
- Learning about REITs – My Free “Course” on REIT Investing for Beginners and Seasoned Investors
- Dividend Stock Tracker – Track all the common 4-10% yielding dividend stocks in SG
- Free Stock Portfolio Tracking Google Sheets that many love
- Retirement Planning, Financial Independence and Spending down money – My deep dive into how much you need to achieve these, and the different ways you can be financially free
- Providend – Where I used to work doing research. Fee-Only Advisory. No Commissions. Financial Independence Advisers and Retirement Specialists. No charge for the first meeting to understand how it works
- Havend – Where I currently work. We wish to deliver commission-based insurance advice in a better way.
Kyith is the Owner and Sole Writer behind Investment Moats. Readers tune in to Investment Moats to learn and build stronger, firmer wealth foundations, how to have a Passive investment strategy, know more about investing in REITs and the nuts and bolts of Active Investing.
Readers also follow Kyith to learn how to plan well for Financial Security and Financial Independence.
Kyith worked as an IT operations engineer from 2004 to 2019. Currently, he works as a Senior Solutions Specialist in Insurance Start-up Havend. All opinions on Investment Moats are his own and does not represent the views of Providend.
You can view Kyith's current portfolio here, which uses his Free Google Stock Portfolio Tracker.
His investment broker of choice is Interactive Brokers, which allows him to invest in securities from different exchanges all over the world, at very low commission rates, without custodian fees, near spot currency rates.
You can read more about Kyith here.
- New 6-Month Singapore T-Bill Yield in Late-April 2024 to Drop to 3.70% (for the Singaporean Savers) - April 18, 2024
- Golden Nuggets from JPMorgan Guide to Retirement 2024. - April 16, 2024
- Be Less Reliant on Banks and Build Stronger Capital Markets by Pushing for Better Shareholder Dividend and Buyback Yield - April 14, 2024
lalaman
Sunday 18th of April 2021
Nice radar chart way of showing the multi factorials to measure investment success.
Like what you mentioned that nothing is binary or good/nogood, you can earn lots of money in your career but the work environment can be very toxic (hence is this closer to a 3 than 5?). Likewise, you can have lots of friends but no deep relationships with any one of them (ditto).
Life can be simple yet complicated at the same time ... even a simple scoring system can be deceptively difficult.
Kyith
Sunday 18th of April 2021
HI lalaman, thanks for the comments. i think gauging between 1 to 5 is easier but you got to think of whether something is a 3 or a 2 or is it a 3 or a 4. It is not so easy as you have said.