I listened to Sarah Newcomb’s interview on Morningstar’s The Long view last week and looked her up as she shared some very interesting things.
Sarah is the director of behavioural science at Morningstar.
In the interview, she shared 5 different metrics that she thinks is a good idea to track on your path to financial independence.
Whenever I notice someone giving some good ratios, I do pay attention. The last time I came across something this interesting was from the book Family Inc. You can read about them here Measures of Health of Family Wealth.
The unique thing about Sarah’s metrics is that they track your progression towards financial independence:
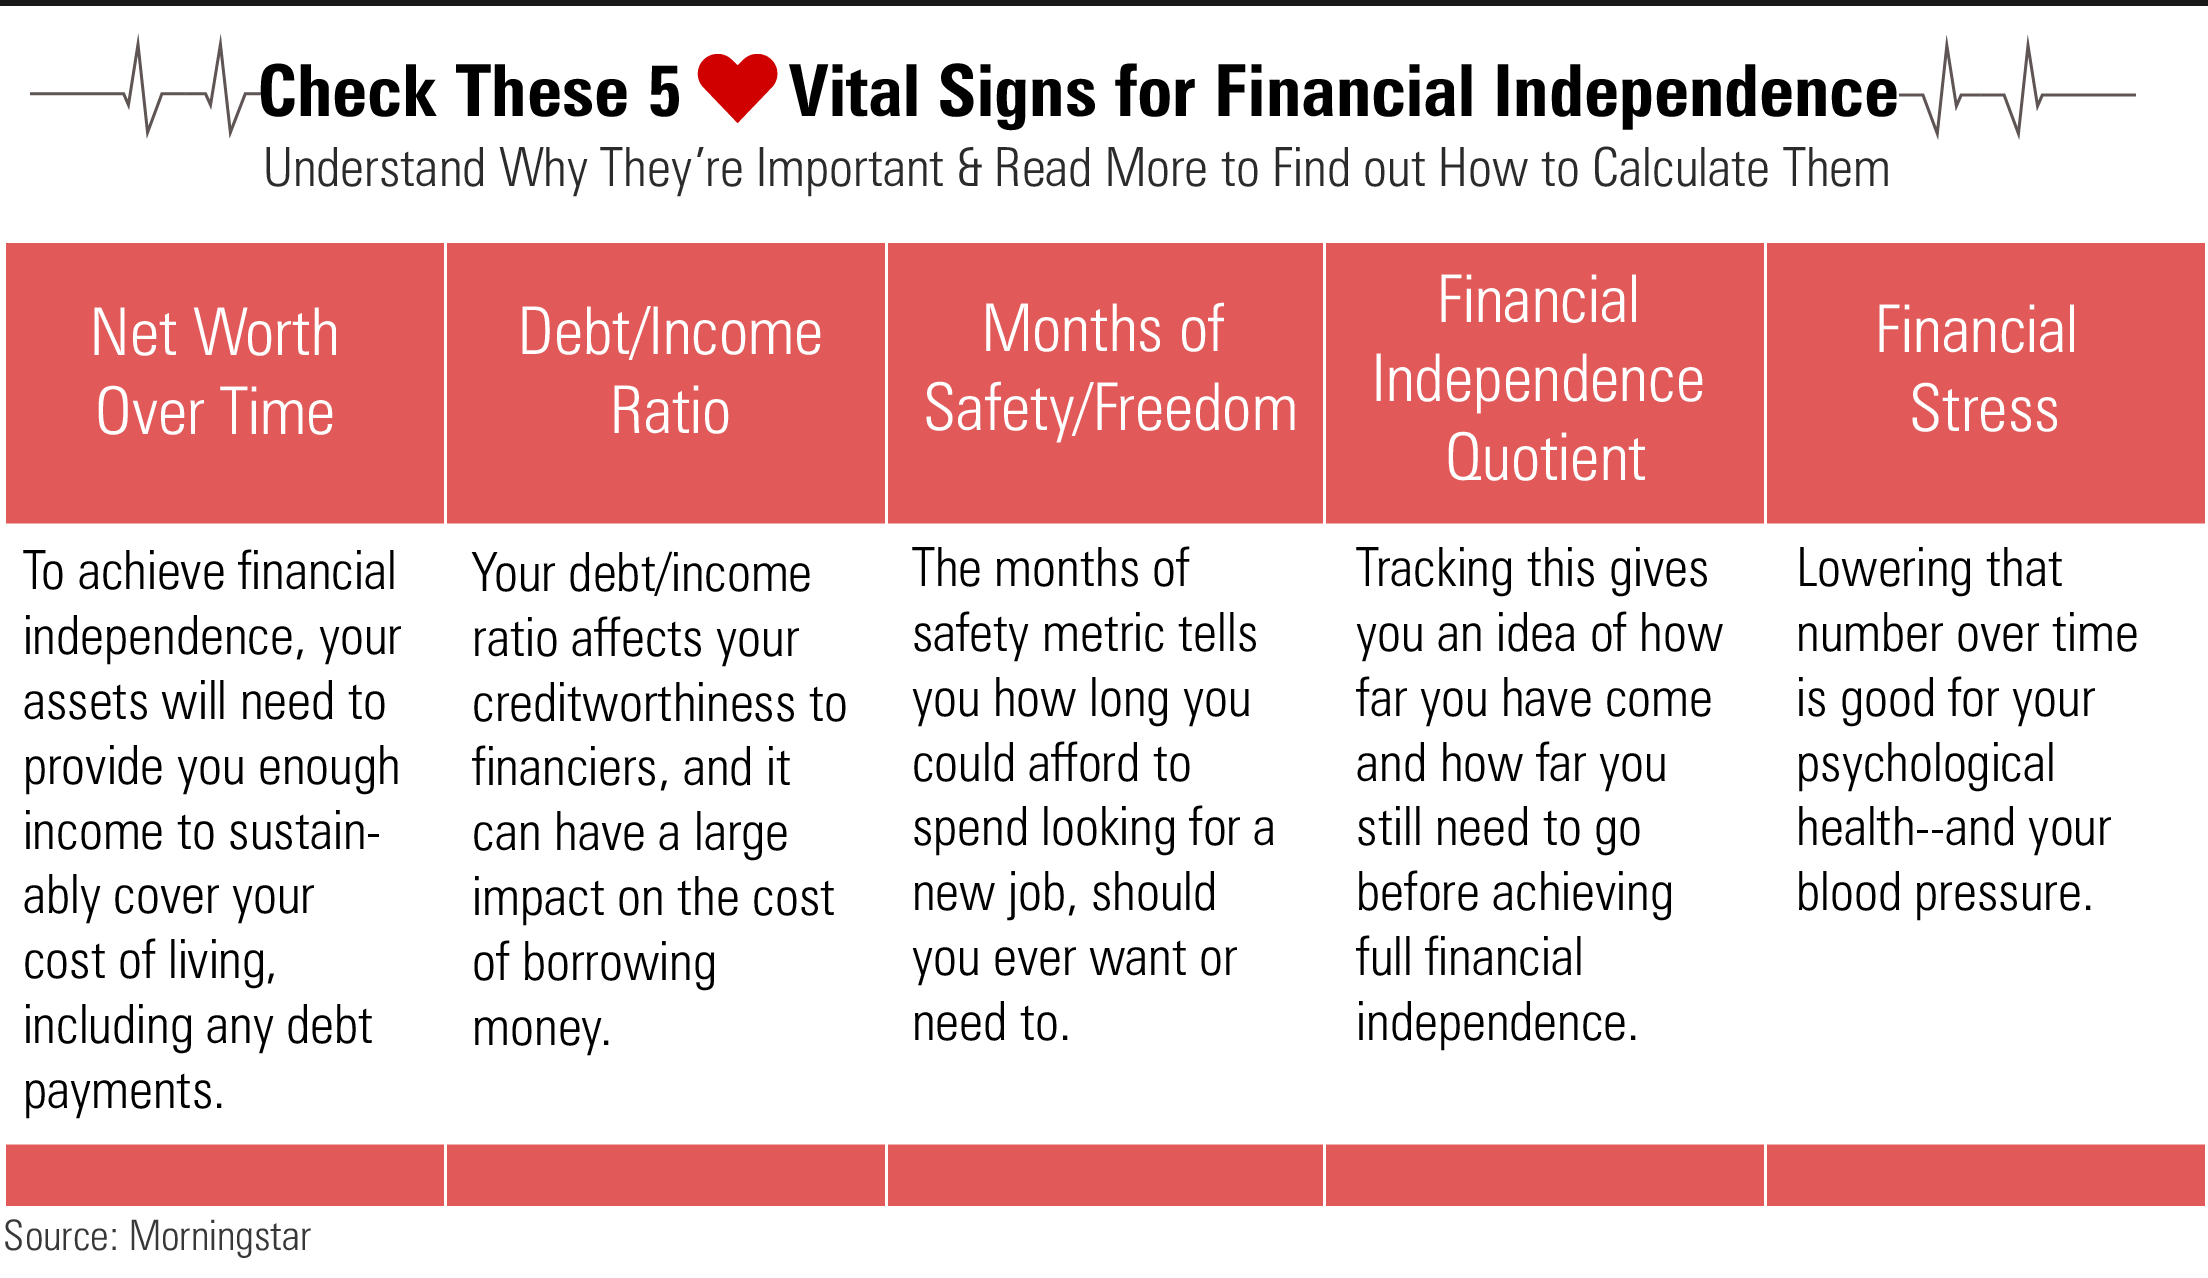
What you would notice is that they focus on the flow.
And Sarah doesn’t use complicated math. She prefers to use rules-of-thumb.
If you track them over time and plot them out, the data tells the story about your progression.
It lets you know:
- Whether you are managing your money well over time.
- Is debt weighing on you and is it improving over time.
- How much safety and freedom you have built up over time.
- Your income versus your expenses builds up over time.
- Are you getting a good handle on your financial anxiety?
We go through each of these, together with some personal examples of mine, where I show you what the charts may look like in real life.
1. Net Worth over Time
How to calculate Net Worth over Time
Take all that you own:
- Cash, deposits, fixed deposits
- Investments
- Residential property
- Investment property
- Businesses
- Government Pension
- Possession of Resale Value
Deduct what you owe:
- Vehicle loan
- Mortgage loan
- Loans on margin
- Unsecured loans
Whatever is leftover is your net worth.
Tabulate your net worth periodically. Maybe once a month. Or once a quarter. You should have a nice graph.
Personally, I would track different kinds of net worth or net equity because they tell a different story:
- Liquid net worth – portion of assets, net of debt that you can sell at a whim
- Net investable assets – portion of assets, net of margin loans, investment property loans, that has potential to generate future cash flow that would be useful for you.
Why Net Worth over Time Matters
- Many people shy away from looking at their net worth because they do not like what they see.
- Net worth over time gives vital signs of the level of financial freedom you have on a flow basis.
- If you have too much debt versus your assets, financial independence will remain out of reach.
- It is ok to have a negative net worth at the beginning of your financial journey. Not all debt is bad. You are taking on debt to improve yourself and harness your earnings potential.
- To be financially independent, assets need to give income to sustainably cover your cost of living, including your debt payment.
My Personal Net Worth over Time
I probably won’t be showing this but I wrote about why this is important in the past.

Tracking the net worth and observing the progress has been something I have been advocating over budgeting for some time.
The advantage is that you don’t have to fret over the little things if you are able to do them well.
You can read Track Your Net Worth First, Before Tracking Your Expenses
2. Debt/Income Ratio
How to calculate Debt/Income Ratio
Add up all your monthly debt payments:
- mortgage
- auto loans
- personal loans
- credit cards
- school loans
Divide them by your pretax monthly income.
What is a healthy Debt/Income Ratio?
There is no fixed rule.
Sarah says if you qualify for the best interest rates and credit cards, keeping your debt/income ratio below 36% is a decent guideline.
Why Debt/Income Ratio Matters
- Debt to Income affects your creditworthiness to financiers.
- Affect your cost of borrowing money.
- How much debt load is weighing you down on a flow basis.
My Personal Debt/Income Ratio
Debt to income ratio is something I do not measure but for those with debt, I thought it is a rather good constant measure.
My personal debt to income ratio stands closer to 7%.
I think if it’s less than 30% it is rather manageable.
3. Months of Safety/Freedom
How to calculate Months of Safety/Freedom
Take your total liquid assets:
- Cash and cash equivalents.
- Liquid investments/assets such as stocks, bonds, unit trusts, ETFs, cryptos. For these liquid investments, you may want to factor in a conservative percentage of how much in value you can liquidate as they can be volatile. For example, 50% of stocks, 90% of bonds, 70% of stock unit trust and ETFs, 90% of bond unit trust and ETFs.
- Do not include illiquid investments such as investment property, investment-linked policies, endowment plans, whole life policies, government pensions and government policies (investment-linked policies and endowment plans by right can be surrendered to gain cash flow, but it is quite debatable so I will leave them out here)
Divide by your total monthly expenses.
You will get the number of months you could go on without a paycheck before you would feel the effects in your day-to-day life.
Sarah only includes cash and equivalents but I feel you can include liquid assets in this.
Why Months of Safety/Freedom Matters
- If you stop work today, how long can you maintain your current lifestyle without liquidating your illiquid assets?
- Tells you how long can you afford to spend looking for a new job if you need to.
- Having several months of safety stored up offers wonderful peace of mind.
- Know the level of freedom you have to change your circumstances. Be in the driver’s seat of your own life and work.
- Factoring in liquid investments extends your short term stability into medium-term stability. It gives you the confidence to invest sensibly. It improves the appeal of liquid investments such as stocks and bonds, unit trusts and ETFs.
- This extends the concept of the emergency fund by not measuring a fixed 3 to 6 months but how much liquidity that you have built up over time with your cash and liquid investments.
- Focus on having a relatively liquid foundation before taking on illiquid investments.
My Personal Months of Safety/Freedom Matters
I like the way Sarah frames this.
And I think more of us should view it this way than just emergency saving. It allows us to see greater fluidity and utility of our cash.
It links our cash to providing freedom and options.
I saw this and decide to go back to my data and created this:

The beauty of tracking your expenses for 7 years is that you can easily recreate this.
The graph looks very wild because the monthly expenses fluctuate.
So in May 2021, the number of months is 641 months. That means in theory I have 53 years of monthly spending queued up.
4. Financial Independence Quotient
How to calculate Financial Independence Quotient
You need to know two things:
- Your total annual spending (average per month x 12 is fine). This can also be the total annual spending based on the lifestyle of not working, or just covering your most essential lifestyle.
- The total annual income you can generate from your assets without draining your principal (Sarah says we can use the quick-and-dirty measure of the 4% rule)
Suppose based on #1 if I do not work, I can have a simple lifestyle that cost $36,000 a year.
Based on #2, you have two income streams. One is an investment property that gives $12,000 a year and an investment portfolio of $300,000. You can apply the 4% initial withdrawal rate and that is projected to give you an income of $12,000 a year.
Total income $24,000.
Your financial quotient would be: $24,000/$36,000 = 66.7%.
This means you are roughly 66.7% financially independent.
These are simple examples but for your situation, it might be rather different.
The goal is to go closer to 100% and beyond.
Why Financial Independence Quotient matters
- Motivation: Gives you an idea of how far you have come.
- Let’s you know how far you will still need to go.
My Personal Financial Quotient

I decide to keep it simple.
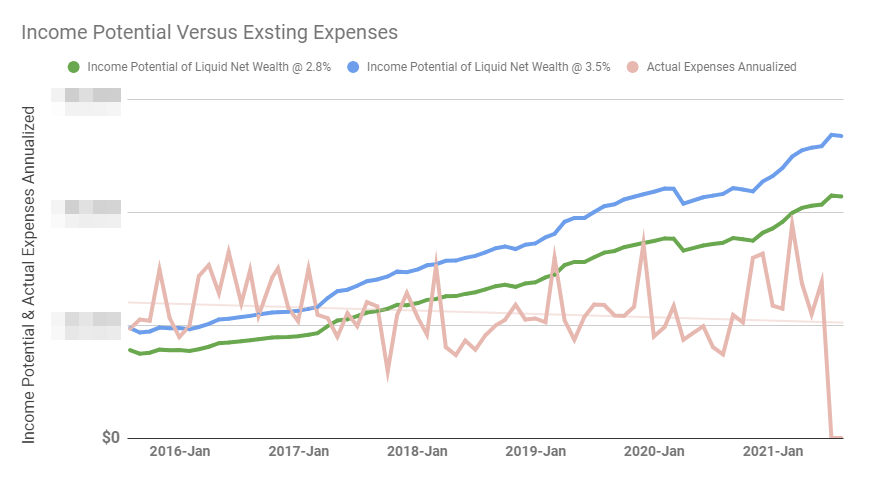
My income from investments is estimated with a 3.5% initial withdrawal rate. This means that I take my liquid net wealth (cash and money on the side + investment portfolio) and simulate an income equal to 3.5% of the liquid net wealth in the first year. For the subsequent years, I would adjust the income based on prevailing inflation. So this is an inflation-adjusted income.
Based on estimation, this income stream should last for 25 to 40 years depending on performance.
If you wish to be conservative.. use a rule of thumb that is lower, perhaps 2.8%. I tend to track 2.8% and 3.5%, one is conservative and another is relatively less conservative.
The goal is to get to 100%.
In a way, I feel I connect less with this purely because it is in percentage.
If there is actual figures, I thought if we are doing it for clients they will relate this better.
5. Financial Stress
How to calculate Financial Stress
Financial stress is a qualitative measure. You take a pulse from 1-10 with 1 being never and 10 being always, how often do you worry about your financial situation.
The lower the number is good.
Do this perhaps periodically every half a year.
Why Financial Stress Matter
- You wanna see if financial anxiety consistently plagues you.
- We wanna see if you ever improve your state of mind by improving your finances.
How to Allocate Your Income in an Elegant View
In another of Sarah’s posts, she shared a very intuitive way of resource allocation.
Managing money is basically trying to allocate money in the best way possible.
Sarah proposes this very simple resource, allocation model:
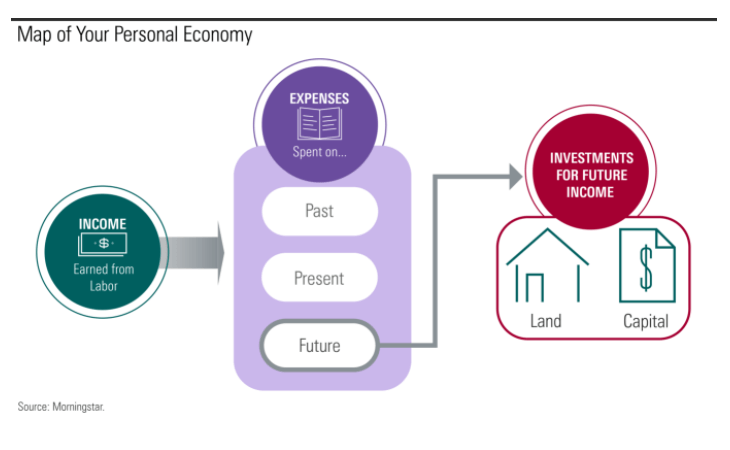
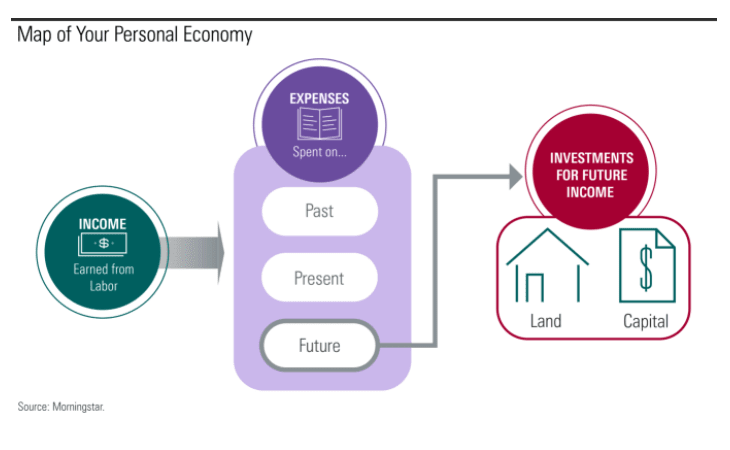
Your income is allocated to your past spending, present and future spending.
I think Sarah helps us frame that
- servicing our debt is our past spending
- saving and investing is for our future spending
Perhaps, the conversation will shift from a lot of strange models to talking about planning for your past, present and future spending.
You need to make sure that you direct some of your labour income toward land and/or capital.
If you do not, financial independence is simply not possible.
Why it Matters
- This framework puts day-to-day purchases and borrowing into a long-term perspective.
- If you don’t invest for the future, you are stuck with your labour as your only source of income.
- This puts your investment in a different perspective. That is, to store up land and capital to provide a sustainable income.
- Allows you to weigh your choices.
The Last Word
You can read Sarah’s piece over here.
The beauty of Sarah’s metrics is that they work with relatively whole figures.
You can just keep track of the aggregate data. My personal experience is that these are the data to keep track of:
- Total debt
- Perhaps long term debt
- Monthly income
- Monthly spending
- Total assets
- Total liquid assets/investments which includes cash
That’s it.
The majority are balance sheet items and monthly spending and income.
So if you wish to keep track of these months by month focus on maybe these 6 items.
Another thing I notice is that more and more, I deviate away from the traditional financial planning way and tend to focus on a few of these rules-of-thumb.
If you understand the meaning behind them, they are easier to focus upon, easier to track, not so tedious and it helps all of our focus on the important stuff.
You can work out your net worth over time, months of safety/freedom, financial independence quotient and debt to income ratio.
How are things looking for you?
I invested in a diversified portfolio of exchange-traded funds (ETF) and stocks listed in the US, Hong Kong and London.
My preferred broker to trade and custodize my investments is Interactive Brokers. Interactive Brokers allow you to trade in the US, UK, Europe, Singapore, Hong Kong and many other markets. Options as well. There are no minimum monthly charges, very low forex fees for currency exchange, very low commissions for various markets.
To find out more visit Interactive Brokers today.
Join the Investment Moats Telegram channel here. I will share the materials, research, investment data, deals that I come across that enable me to run Investment Moats.


Do Like Me on Facebook. I share some tidbits that are not on the blog post there often. You can also choose to subscribe to my content via the email below.
I break down my resources according to these topics:
- Building Your Wealth Foundation – If you know and apply these simple financial concepts, your long term wealth should be pretty well managed. Find out what they are
- Active Investing – For active stock investors. My deeper thoughts from my stock investing experience
- Learning about REITs – My Free “Course” on REIT Investing for Beginners and Seasoned Investors
- Dividend Stock Tracker – Track all the common 4-10% yielding dividend stocks in SG
- Free Stock Portfolio Tracking Google Sheets that many love
- Retirement Planning, Financial Independence and Spending down money – My deep dive into how much you need to achieve these, and the different ways you can be financially free
- Providend – Where I used to work doing research. Fee-Only Advisory. No Commissions. Financial Independence Advisers and Retirement Specialists. No charge for the first meeting to understand how it works
- Havend – Where I currently work. We wish to deliver commission-based insurance advice in a better way.
Kyith is the Owner and Sole Writer behind Investment Moats. Readers tune in to Investment Moats to learn and build stronger, firmer wealth foundations, how to have a Passive investment strategy, know more about investing in REITs and the nuts and bolts of Active Investing.
Readers also follow Kyith to learn how to plan well for Financial Security and Financial Independence.
Kyith worked as an IT operations engineer from 2004 to 2019. Currently, he works as a Senior Solutions Specialist in Insurance Start-up Havend. All opinions on Investment Moats are his own and does not represent the views of Providend.
You can view Kyith's current portfolio here, which uses his Free Google Stock Portfolio Tracker.
His investment broker of choice is Interactive Brokers, which allows him to invest in securities from different exchanges all over the world, at very low commission rates, without custodian fees, near spot currency rates.
You can read more about Kyith here.
- New 6-Month Singapore T-Bill Yield in Late-April 2024 to Drop to 3.70% (for the Singaporean Savers) - April 18, 2024
- Golden Nuggets from JPMorgan Guide to Retirement 2024. - April 16, 2024
- Be Less Reliant on Banks and Build Stronger Capital Markets by Pushing for Better Shareholder Dividend and Buyback Yield - April 14, 2024