Last week, we received an announcement that with effect from 1st July 2021, the policy illustrated investment rate (PIRR) will be lowered from 4.75% to 4.25% and 3.25% to 3.00% respectively.
What is Your Policy’s Illustrated Investment Rate (PIRR)?
Some of your insurance policies accumulate cash values. You contribute additional capital, on top of insurance charges to it.
The insurance companies will take your capital and invest in a participating fund. You can see this partipating fund as a pool of stocks, bonds, cash, property investments managed by a group of managers, much like your unit trust, hedge fund with a certain mandate.
The performance of this participating fund’s return determines how much cash value is accumulated.
Typically, endowment plans, limited whole life plans are the kind of policies whose cash value is tied to the performance of the participating fund.
Term plans do not accumulate values so they are not impacted by this illustrated investment rate in any way. Investment-linked policies (ILP) performance is tied to the underlying unitt trust chosen and therefore are not affected by this. Universal life policy returns are typically determined by crediting rate or a hybrid benchmark for those indexed link, so they are less affected by this as well.
The following extracts are taken from a policy’s benefits illustration:
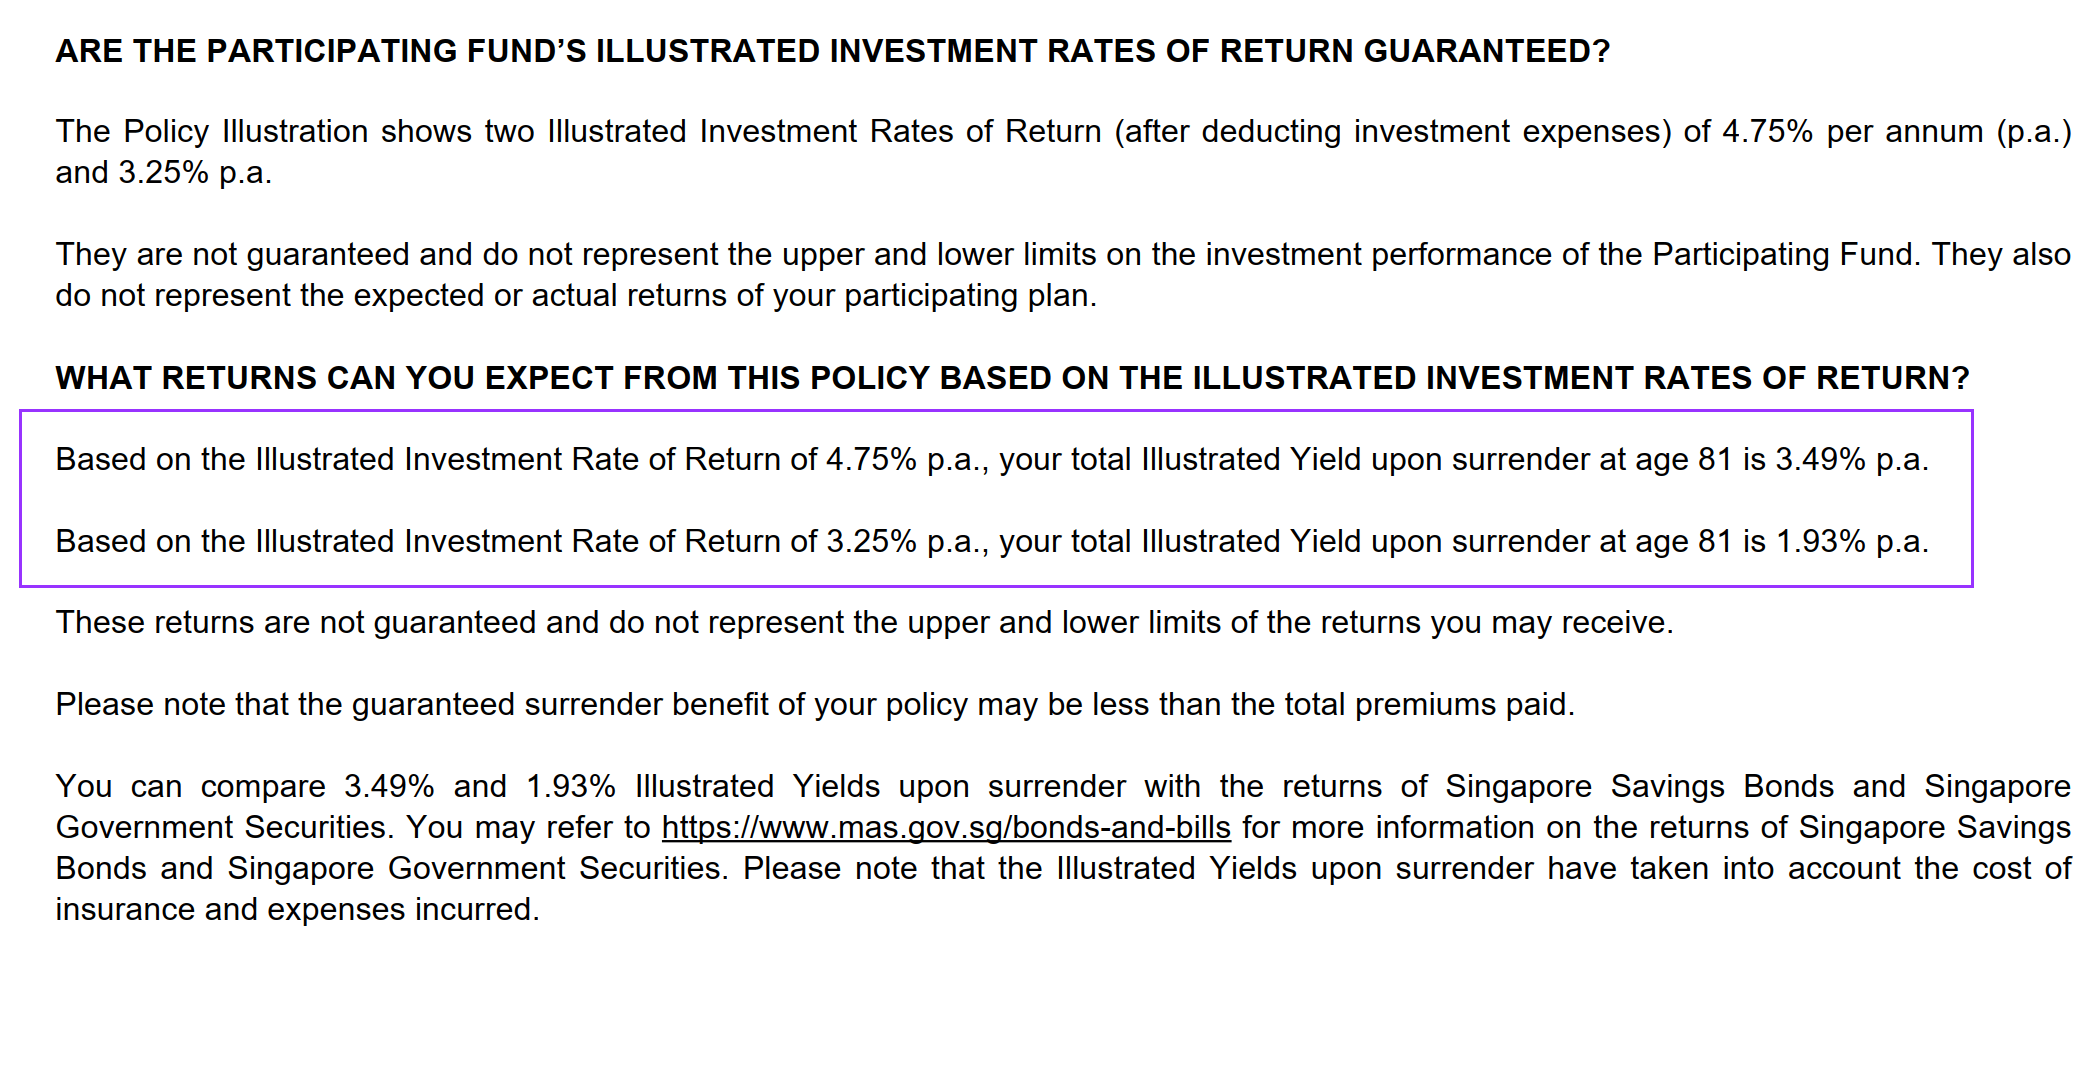
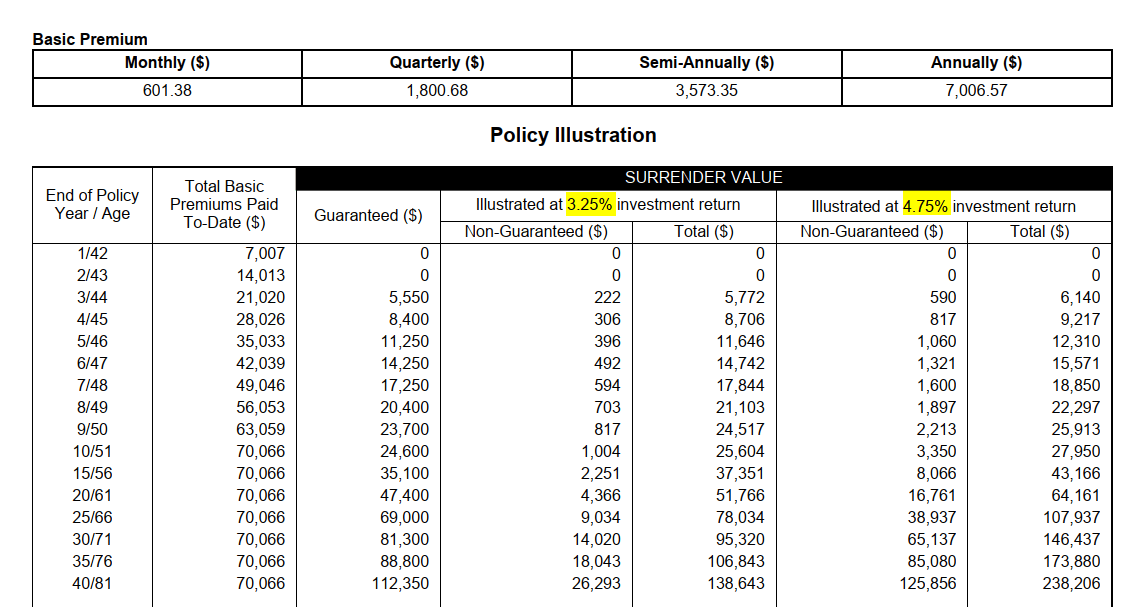
You can see that there are two investment rate of return provided to illustrate to you how much value your policy will accuulate in due time.
One is a optimistic rate (4.75% a year) the other is conservative (3.25% a year)
This is for illustrative purpose. It does not mean that the eventual investment return will fall between 3.25% and 4.75%.
Here are the actual historical investment return of different insurance companies:
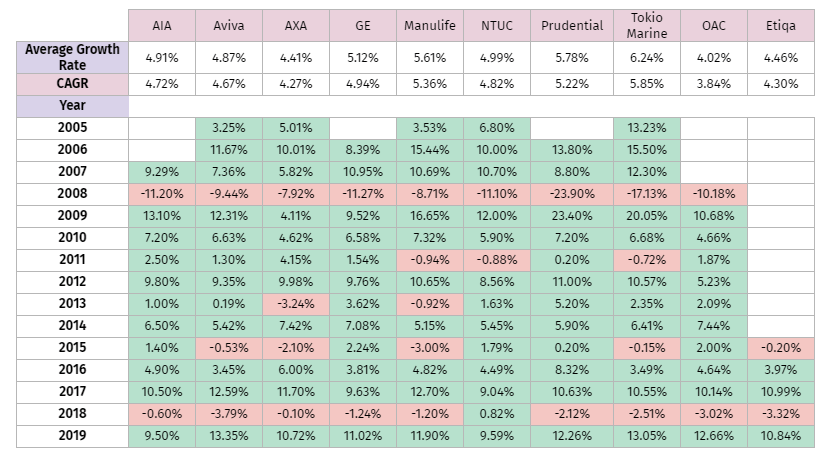
You will notice that year to year, the investment return varies.
It is important for you to note: You do not get this return. There are insurance and investment cost that have to be deducted.
The benefits illustration tells you IF the long term returns is 3.25% or 4.75%, that is the cash value accumulate. Not that you will earn all the 3.25% or 4.75%.
In the past, I have crowd-sourced the actual cash value policy returns of matured policy.
Read Does your Insurance Saving Plans (Endowment) give you 3 to 5% returns?
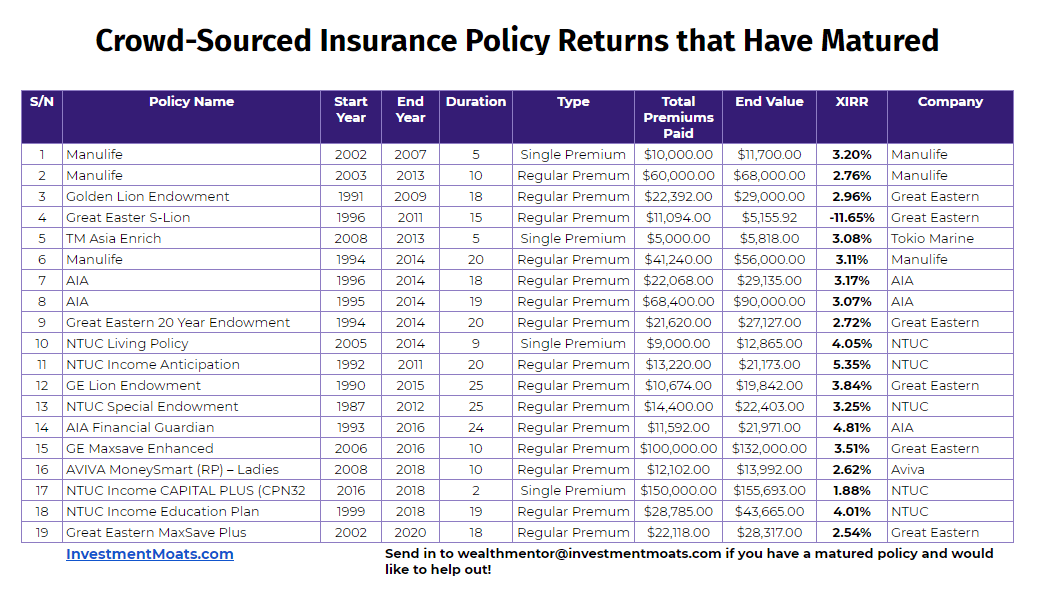
When these readers, family members were recommended these policies, the illustrated investment returns were higher. Some may be 7% and 6%. Some were 5.25% and 3.75%.
The eventual returns were in this range.
What are the Illustrated Changes?
Basically when these policies are recommended to you, the illustrated investment rates will be lowered:
- Optimistic rate down from 4.75% to 4.25%
- Conservative rate down from 3.25% to 3.00%
Here is the official word:
This is part of the industry’s annual review of the caps of the illustrated rate of return to ensure ongoing relevance and appropriateness.
The change is made after careful consideration of historical, recent and potential future global economic market outlook, in particular market interest rates, which has decreased significantly over the last few years.
The last revision of PIIRR was made in 2013.
The PIRR is for illustrative purposes, and do not represent the upper and lower limits of the investment performance of an insurer’s participating fund.
The rates used in the PI are not a reflection of the actual returns of both existing and future PAR policies. The actual returns received from a PAR policy will depend on the actual experience, including investment performance, of the PAR Fund that will develop over the lifetime of the PAR policy.
Actual investment returns in the future will depend on the future economic conditions, actual asset class returns and asset allocation of the PAR Fund. Eventual actual returns received by policyholders may be higher or lower than those reflected within the PI.
Here are the illustrated rates used, from what I can remember:
| Period | Optimistic | Conservative |
| 1994 to 1997 | 7% | |
| 1997 to 2002 | 6% | |
| 2002 to 2013 | 5.25% | 3.75% |
| 2013 to 2021 | 4.75% | 3.25% |
| 2021 July onwards | 4.25% | 3.00% |
What is the Likely Impact?
I think in terms of actual impact this is low.
These are after all illustrations. Not the actual returns.
However, reducing the illustrated rate does make it more challenging to sell to sell to prospects.
If you review the illustrations, the project cash value of the conservative rates look quite “pathetic” in the eyes of prospects.
The IRR or long term “interest rate” is around 2% a year now. Now, they have to adjust it lower to less than 2%!
It is no wonder that sales people will shift the attention towards the optimistic rate of 4.75%.
The falling illustration rate is a function of our low growth environment. The primary driver is future bond returns.
Participating funds have severe limitation to what they can invest in. Typically they are 60-65% bonds, 35%-40% equity.
Future bond returns are strongly correlated to current yield, and current yield is much lower than in the past.
And if the participating funds has majority of the allocation in bonds, future returns will be low.
Equities are at high long term valuations, and in the long run, your returns are very much tied to long term valuations. The likely returns, estimated on a conservative basis will be lower.
Your future returns are likely to be lower.
Insurance companies have contractual obligations to you the policy holder. So they have to very careful in their estimation and what they can invest in.
To take on more risks in the participating fund, the insurance company may need to set aside more reserves. Setting aside more is an overhead for the insurance companies.
All in all, this points to a challenging environment.
I am starting to hear some of the higher ups say the business of participating funds is not good in the future.
I do expect the marketing to change and influence prospects to shift to investment-linked policies. These policies are less constrained and the prospect has a higher probability to have higher accumulated cash value.
Its just taking on more risks.
However, most of the investment-linked policies are active unit trusts, and these policies have a complex cost structure.
The active unit trusts operate in a similar low return, high valuation economic regime as the participating fund as well.
Let me hear your thoughts.
I invested in a diversified portfolio of exchange-traded funds (ETF) and stocks listed in the US, Hong Kong and London.
My preferred broker to trade and custodize my investments is Interactive Brokers. Interactive Brokers allow you to trade in the US, UK, Europe, Singapore, Hong Kong and many other markets. Options as well. There are no minimum monthly charges, very low forex fees for currency exchange, very low commissions for various markets.
To find out more visit Interactive Brokers today.
Join the Investment Moats Telegram channel here. I will share the materials, research, investment data, deals that I come across that enable me to run Investment Moats.


Do Like Me on Facebook. I share some tidbits that are not on the blog post there often. You can also choose to subscribe to my content via the email below.
I break down my resources according to these topics:
- Building Your Wealth Foundation – If you know and apply these simple financial concepts, your long term wealth should be pretty well managed. Find out what they are
- Active Investing – For active stock investors. My deeper thoughts from my stock investing experience
- Learning about REITs – My Free “Course” on REIT Investing for Beginners and Seasoned Investors
- Dividend Stock Tracker – Track all the common 4-10% yielding dividend stocks in SG
- Free Stock Portfolio Tracking Google Sheets that many love
- Retirement Planning, Financial Independence and Spending down money – My deep dive into how much you need to achieve these, and the different ways you can be financially free
- Providend – Where I used to work doing research. Fee-Only Advisory. No Commissions. Financial Independence Advisers and Retirement Specialists. No charge for the first meeting to understand how it works
- Havend – Where I currently work. We wish to deliver commission-based insurance advice in a better way.
Kyith is the Owner and Sole Writer behind Investment Moats. Readers tune in to Investment Moats to learn and build stronger, firmer wealth foundations, how to have a Passive investment strategy, know more about investing in REITs and the nuts and bolts of Active Investing.
Readers also follow Kyith to learn how to plan well for Financial Security and Financial Independence.
Kyith worked as an IT operations engineer from 2004 to 2019. Currently, he works as a Senior Solutions Specialist in Insurance Start-up Havend. All opinions on Investment Moats are his own and does not represent the views of Providend.
You can view Kyith's current portfolio here, which uses his Free Google Stock Portfolio Tracker.
His investment broker of choice is Interactive Brokers, which allows him to invest in securities from different exchanges all over the world, at very low commission rates, without custodian fees, near spot currency rates.
You can read more about Kyith here.
- My Dividend Experience Investing in UCITS iShares iBond Maturing in 2028. - April 23, 2024
- We Invest into Popular Funds When They Are Popular, Exactly When They Started Turning to Shxt. - April 22, 2024
- Meal Prep 2.0 – Cooking Your “Go-to” Meal that You Look Forward to Eating Everyday. - April 21, 2024
Sinkie
Monday 31st of May 2021
I remember in the old days there wasn't a mandated figure by LIA or MAS; basically each insurer could print whatever they wanted based on their historical performance & future confidence.
The WL I bought in the early-1990s was based on 6.5% projection (written in fine print at the bottom of the page), and yes it was just 1 column.
The equity curve of the accumulated surrender value was good till Asian Financial Crisis. The gradient became shallower but still OK. Until GFC. After 2007, it's been crap.
But since it's a small part of my expense, and the annual rate of increase (so far) is still better than FDs or money market, just continue paying. Part of my cash & safe assets portion.
Maybe insurers will start headhunting staff from SWFs & Ivy League endowments to allocate more into private equity.
The days of closet indexing & lazy investment (even though we pay high expenses!) is over. I remember a social enterprise at one time simply putting 1/3 of their fund into STI ETF?!?!?! Majority still outsource 80% to 3rd party fund houses like Vanguard, Fidelity, Nikko, Franklin Templeton, Fullerton, etc.
Kyith
Monday 31st of May 2021
Hi Sinkie, thanks for sharing that bit of history. To take on more private equity, they would have to change the mandate isn't it?