Drizzt: long term market analysis is a series once or twice a month where we take a look at longer term trends in the market to get our bearings right on the general direction of where market prices is going.
Markets have turned out pretty well for those that are long. However, the January move was so sudden that many were waiting for the pull back that never came. It looks synonymous with all the past big moves that markets remain overbought and stayed over bought.
Weekly S&P500 and STI
The long term indicator we use is the cross over between the 17 week EMA and the 43 week EMA. A cut of the 17 week EMA below the 43 week EMA from above signifies an underweight and risk management position. A cut of the 17 week EMA above the 43 week EMA from below signifies an overweight position in equities.
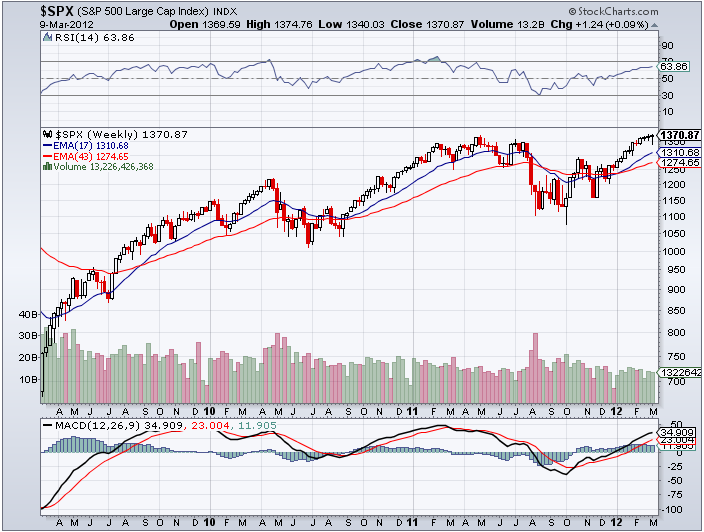

US Markets have taken a 3 week pause at the high in 2011. Resistance looks strong and would take some effort for the bulls to push through. RSI above 40 and MACD above 0 looks favorable to stay long.
What is favorable is that this pause could work off all the overbought conditions in the market and the bears have been losing strength, getting beaten up during every correction.
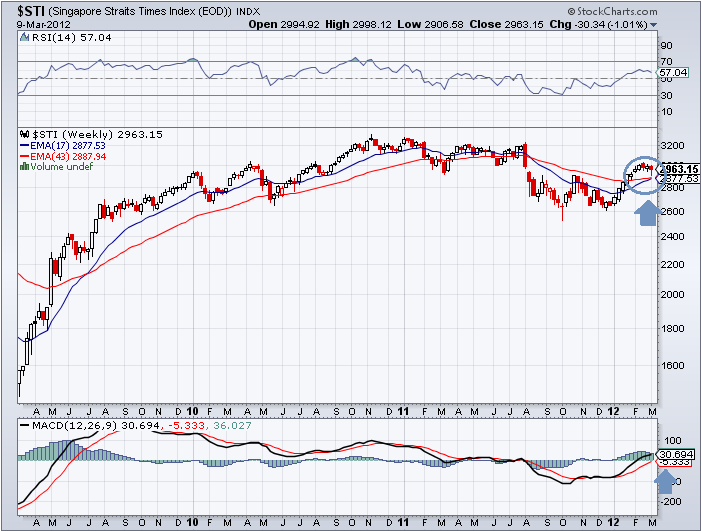

The STI is playing abit of a catchup. the 17 week EMA is about to cut the 43. It doesn’t look very demanding at all. The past few weeks break could be good to take the index higher.
Trend looks like it can go on and on
Peter Brandt sums it up best that this looks very much like a continuation and could go on for some time. At times take away those breadth indicators and moving average and focus on the price and it does feel like we are in a very stable bull state.
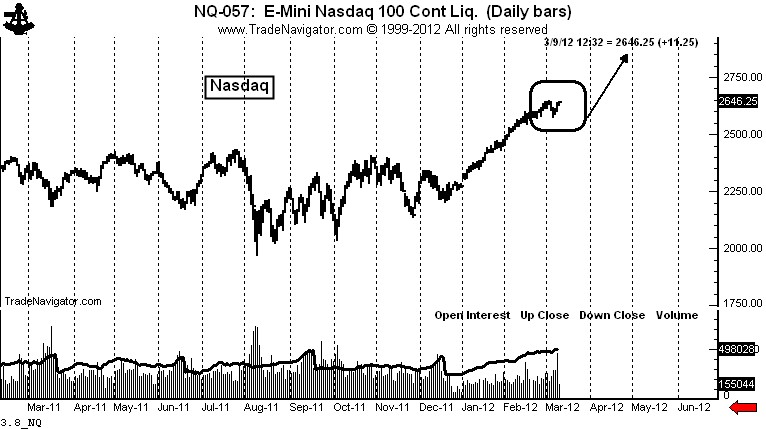
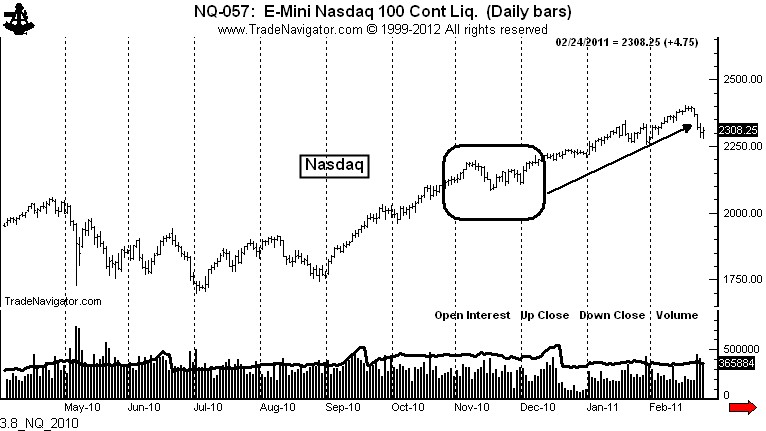
The type of sustained steady rally we have experienced from the December low seldom terminates with a top. This steady unrelenting rally is an indication of a dominant trend that will continue. Breaks are a buying opportunity.
For those interested in tracking my most current holdings, you can review my portfolio over here. Learn to use our Free Stock Portfolio Tracking Google Spreadsheet to track stock transactions.
Do Like and +1 if you find it useful!
Kyith is the Owner and Sole Writer behind Investment Moats. Readers tune in to Investment Moats to learn and build stronger, firmer wealth foundations, how to have a Passive investment strategy, know more about investing in REITs and the nuts and bolts of Active Investing.
Readers also follow Kyith to learn how to plan well for Financial Security and Financial Independence.
Kyith worked as an IT operations engineer from 2004 to 2019. Currently, he works as a Senior Solutions Specialist in Insurance Start-up Havend. All opinions on Investment Moats are his own and does not represent the views of Providend.
You can view Kyith's current portfolio here, which uses his Free Google Stock Portfolio Tracker.
His investment broker of choice is Interactive Brokers, which allows him to invest in securities from different exchanges all over the world, at very low commission rates, without custodian fees, near spot currency rates.
You can read more about Kyith here.
- New 6-Month Singapore T-Bill Yield in Late-April 2024 to Drop to 3.70% (for the Singaporean Savers) - April 18, 2024
- Golden Nuggets from JPMorgan Guide to Retirement 2024. - April 16, 2024
- Be Less Reliant on Banks and Build Stronger Capital Markets by Pushing for Better Shareholder Dividend and Buyback Yield - April 14, 2024