Drizzt: long term market analysis is a series once or twice a month where we take a look at longer term trends in the market to get our bearings right on the general direction of where market prices is going.
In our last long term analysis 20 days ago [analysis here >>], I mentioned we are likely to resume the uptrend due to what I observed on the price movement and the seasonal factor (November to April).
This weeks drawdown makes me question that last deduction
Weekly S&P500 and STI
The long term indicator we use is the cross over between the 17 week EMA and the 43 week EMA. A cut of the 17 week EMA below the 43 week EMA from above signifies an underweight and risk management position. A cut of the 17 week EMA above the 43 week EMA from below signifies an overweight position in equities.
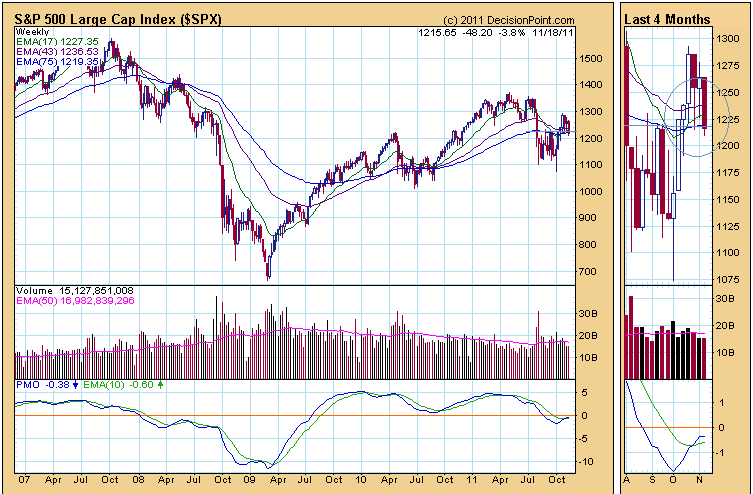
We were on the verge of a 17/43 Week EMA bullish cross over but this week’s movement delays that conclusion. Next week becomes important. A successfully draw down next week will take us below 1200, which is important considering how many important breakouts, resistance and support takes place over here.
Things are still redeemable for the bulls but I don’t like the looks of the PMO looking to turn lower week wise.
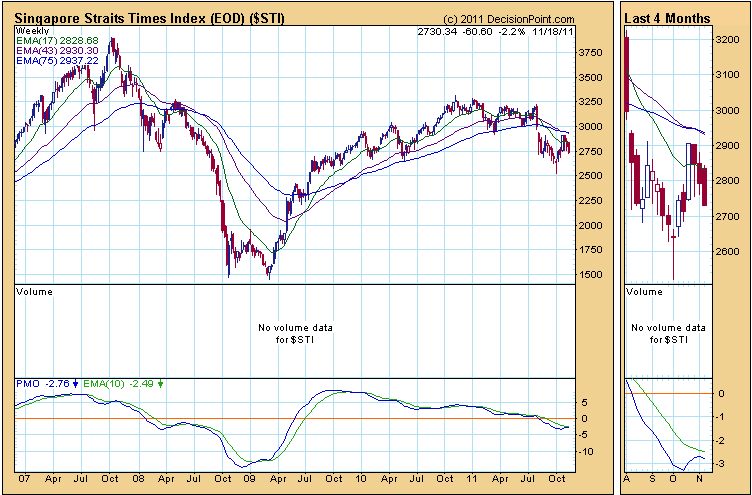
In contrast, the STI looks to be in a worse shape. In the last analysis, I highlighted the caution on the Hang Seng and STI not looking favorable versus the US charts. Fundamentally, my take is that there can be a slight decoupling taking place.
US markets may do much better than the Asian markets. It will be bad for Singaporean investors investing only in the Singapore market.
The resistance area at 2920 looks strong. The STI needs a lot of energy to make a successive move up. I am not optimistic at all.
Daily S&P500 and STI
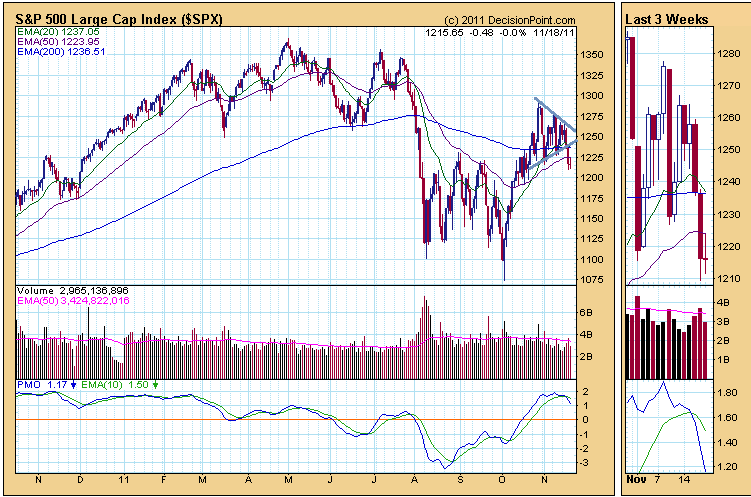
On the daily charts, the S&P 500 was forming a nice triangle formation. Typically the end of the triangle resolve towards the direction of the entry, which is up. However, the draw down invalidate the formation.
The damage isn’t huge. If this market have strength, next week will tell us a lot about the direction.
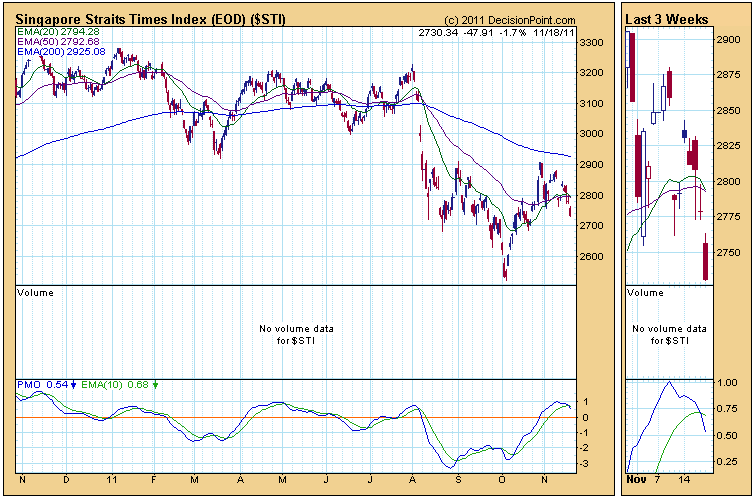
The STI looks bad. But I was wondering if a potential huge bullish inverse heads and shoulders is forming. The PMO cutting down seem to indicates that we should be doing some form of risk management.
Portfolio Movement
Currently I am 40% invested. It was 46% a few days before but I am rather cautious after taking leave and doing my evaluation yesterday. This is a good position to be in.
- A resumption draw down would enable us to pick good counters. Rather it will be the second chance for those that say they regretted not buying up. But will they do it this time round?
- An uptrend next 2 weeks is good. We could be forming a great inverse head and shoulders. I will add my position then to 50-70% of my portfolio.
- I don’t think it will go non-direction. But if it does I think my stocks should do reasonably well
Current large holdings includes KepCorp, SembCorp Industries, First REIT, Starhub, Singtel, MIIF and CMPacific. Depending on next week I may review KepCorp and SembCorp if I can collect them lower. Always looking to add to existing holdings.
For those interested in tracking my most current holdings, you can review my portfolio over here. Learn to use our Free Stock Portfolio Tracking Google Spreadsheet to track stock transactions.
Kyith is the Owner and Sole Writer behind Investment Moats. Readers tune in to Investment Moats to learn and build stronger, firmer wealth foundations, how to have a Passive investment strategy, know more about investing in REITs and the nuts and bolts of Active Investing.
Readers also follow Kyith to learn how to plan well for Financial Security and Financial Independence.
Kyith worked as an IT operations engineer from 2004 to 2019. Currently, he works as a Senior Solutions Specialist in Insurance Start-up Havend. All opinions on Investment Moats are his own and does not represent the views of Providend.
You can view Kyith's current portfolio here, which uses his Free Google Stock Portfolio Tracker.
His investment broker of choice is Interactive Brokers, which allows him to invest in securities from different exchanges all over the world, at very low commission rates, without custodian fees, near spot currency rates.
You can read more about Kyith here.
- New 6-Month Singapore T-Bill Yield in Late-April 2024 to Drop to 3.70% (for the Singaporean Savers) - April 18, 2024
- Golden Nuggets from JPMorgan Guide to Retirement 2024. - April 16, 2024
- Be Less Reliant on Banks and Build Stronger Capital Markets by Pushing for Better Shareholder Dividend and Buyback Yield - April 14, 2024
patrick lim
Sunday 20th of November 2011
hi, drizzt,
i caught a cnbc program this week and the expert interviewed was none other than ms bartels, top technical analyst of bank of america merrill lynch.
she was asked about the direction of the s&p 500 index and she thinks it will break the current support level of 1200 points.
may i ask what is your take on this, buddy? fyi, i tend to go with her view.
thanks and God Bless.
Drizzt
Sunday 20th of November 2011
Hi Patrick, long time no see!
If you ask me this question 1 week ago i would say the bull resumption is more likely. This week's 2 2% drawdown seems to change that view alot. My muse are longer term charts and they do look like my misgiving that it will resume the uptrend could be true. Hang Seng and STI looks not to be turning up and US market although it looks like it will turn now very much look like the test in 2007 before drifting lower.
the damage is not done yet. next week could tell us alot.
Best Regards
James Kwan
Saturday 19th of November 2011
Hi, I'm a regular reader of your blog, and I like your analysis.
I like the major IHS on the STI. I've been reading several blog analysis on the US indices like the S&P, and several are predicting a huge upward move towards the end of the year. I'm sure thinking what event will trigger this upward move.
Also in early-mid 2012, many are predicting a major recession. What are your thoughts?
Drizzt
Saturday 19th of November 2011
thanks James, i always held the view that the 2 factors have a high upward probability but the way i see the singapore index it looks very far off from a bullish formation.
plan for both scenario. next 2 weeks might tell us whether we have a IHS!