long term market analysis attempts to identify the general trend the market, whether bullish or bearish. stay vested when trend is bullish and trigger downside controls when trend is bearish
S&P 500
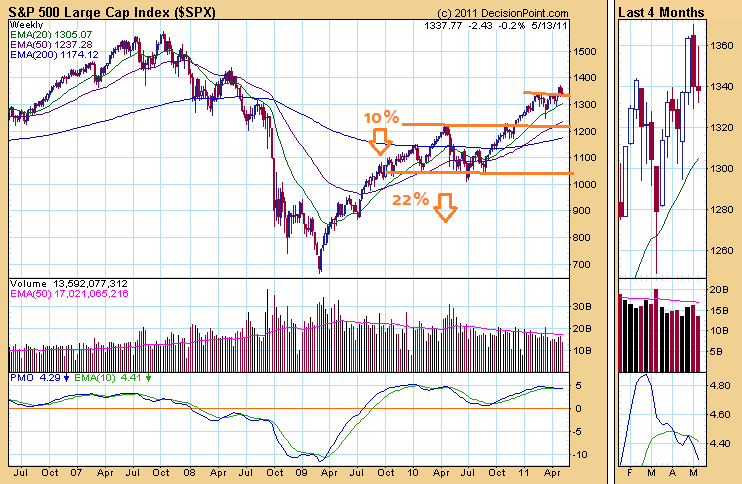

Every one is watching the 1340 level on the S&P500. Violation of it will invalidate the reverse heads and shoulders breakout. Breaking out will continue the upward trend but invalidate it will not be a death sentence.
We are still well above the 200 EMA. A death cross at 200,50 and 20 EMA at 1180 will be about a 10% drawdown from current levels.
A 10% drawdown on the index looks tolerable, but most investors owns individual stocks and likely the drawdown will be larger.
By the time the death cross happens it is likely the draw down is 22%.
STI
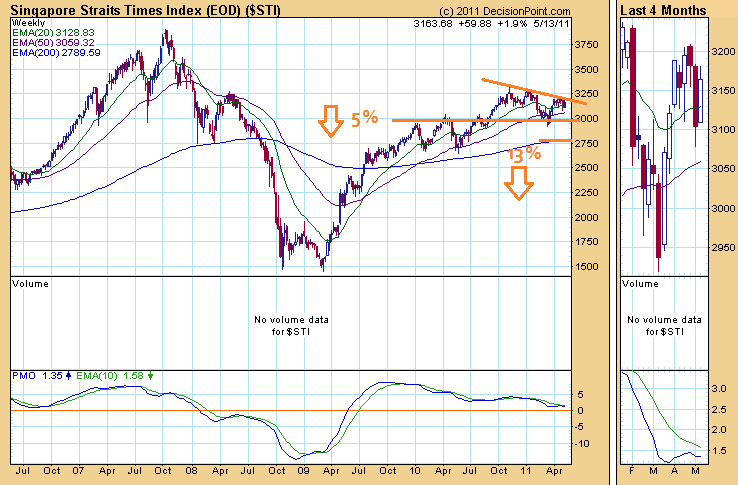

I like the look of the STI much better than that of S&P500. We are in a consolidation stage and a breach of 3200 could see a resumption of further upside. Holding dividend stocks in this current environment seems to be a plan of not doing any stupid selling and knowing when to get out.
However, the consolidation have brought the 20 and 50 EMA close. Further downside to below 3000 will trigger a sell of most growth stocks I have and some profit taking.
The drawdown then is 5% which would likely mean a 10% correction on most individual stocks.
The 2750 level is a point where we can observe and selectively add more stocks should this level holds. If not, we can lighten up most of our holdings to collect at cheaper prices.
I run a free Singapore Dividend Stock Tracker . It contains Singapore’s top dividend stocks both blue chip and high yield stock that are great for high yield investing. Do follow my Dividend Stock Tracker which is updated nightly here.
Kyith is the Owner and Sole Writer behind Investment Moats. Readers tune in to Investment Moats to learn and build stronger, firmer wealth foundations, how to have a Passive investment strategy, know more about investing in REITs and the nuts and bolts of Active Investing.
Readers also follow Kyith to learn how to plan well for Financial Security and Financial Independence.
Kyith worked as an IT operations engineer from 2004 to 2019. Currently, he works as a Senior Solutions Specialist in Insurance Start-up Havend. All opinions on Investment Moats are his own and does not represent the views of Providend.
You can view Kyith's current portfolio here, which uses his Free Google Stock Portfolio Tracker.
His investment broker of choice is Interactive Brokers, which allows him to invest in securities from different exchanges all over the world, at very low commission rates, without custodian fees, near spot currency rates.
You can read more about Kyith here.
- My Dividend Experience Investing in UCITS iShares iBond Maturing in 2028. - April 23, 2024
- We Invest into Popular Funds When They Are Popular, Exactly When They Started Turning to Shxt. - April 22, 2024
- Meal Prep 2.0 – Cooking Your “Go-to” Meal that You Look Forward to Eating Everyday. - April 21, 2024