In my introductory post on factor investing, one of the more popular factors is the momentum factor.
The momentum factor, is rather controversial.
On the surface, the economic drivers behind the momentum style are not clear. It makes little sense to buy a basket of stocks whose price is higher than a few months ago.
Eugene Fama wrote about it and thinks it is that kind of anomaly where the results show it works but fundamentally it is hard to agree with. Professor Robert Novy-Marx believes that what drives momentum is driven by strong earnings performances.
In general, some believed the momentum premium exist because behavorially many believed what goes up, cannot go up further. In a way, betting on momentum is betting on longer, intermediate term continuation.
The momentum style, along with the value style are two of the strongest factor styles out there. The factors show up over different time periods, across different regions, across different asset classes and investment vehicles.
And in a way, quant ETFs try to pair them together because they are so less correlated with each other, but if you invest over a longer term, you get a smoother ride.
Positioning for Exposure to the Momentum Style with the iShares Edge MSCI World Momentum Factor UCITS ETF (IWMO)
The IWMO selects a sub-basket of stocks from the MSCI World universe that exhibit stronger past-intermediate term momentum.
The fund ranks each stock based on their price performance from
- 12 months – 1 month ago (50% weightage)
- 6 months – 1 month ago (50% weightage)
- #1 and #2 is adjusted by the 3-year weekly volatility of the stock so as to normalize the natural volatility of the stock
1 month was deducted because study shows that if you select the stocks with the strongest 1-month momentum, their performance tend to revert in the next month. Thus, the most recent month performance was eliminated (this is very research and quantitative. It is that woo woo.)
If you had always favored investing in stocks that exhibit strong momentum, but wanted someone to screen, rank and invest systematically for you, then the IWMO allows you to do that in a systematic manner.
The ETF holds 300 stocks, has a total expense ratio of 0.30%, and a total fund size of US$2.6 billion.
This is a UCITS fund domiciled in Ireland, listed on the London Stock Exchange, so there are better withholding and estate tax efficiency.
The fund rebalances twice a year during end of May and end of November.
Large Sectoral Changes During Latest Rebalancing
A few months ago, I was pondering about how the momentum index would look like during the next rebalancing.
This is because during the last few months, we have seen a sector rotation in performance. The information technology and consumer discretionary companies have corrected and in their place, the finance, energy, materials company are doing better.
So I wonder how would the mix be like come May.
3Fourteen Research, a team that came out from Ned Davis Research, were some of the early people that prompt us about the shift:
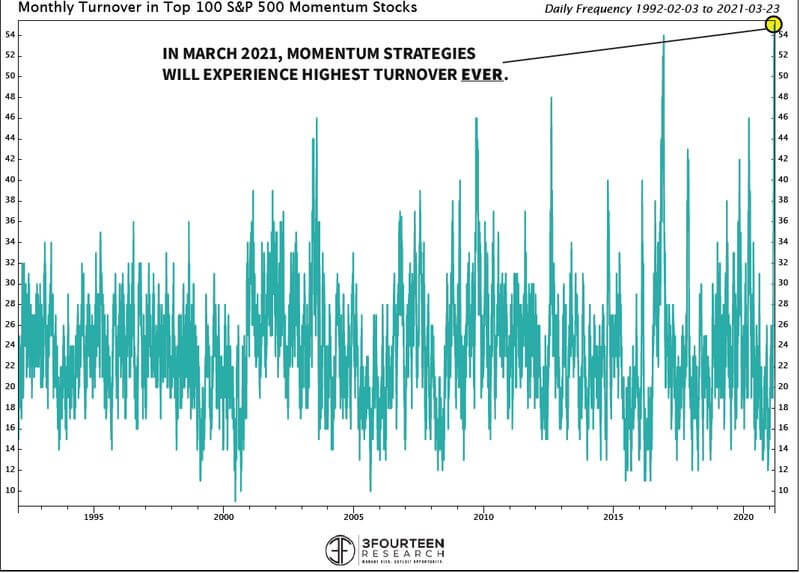
They forecast that this rebalancing would be one of the rebalancing with the highest turnover. In the past, the rebalance is likely to be between the information technology, and consumer discretionary companies, which have the strongest momentum.
The chart above shows the historical turnover of the top 100 S&P 500 momentum stocks.
These quant moves can ripple through broader benchmarks. Momentum is popular within the roughly $2 trillion systematic community which groups stocks together by their characteristics, an approach is known as factor investing. Exchange-traded funds tied to momentum command $20 billion in the U.S. alone.
Bloomberg
The fear or opportunity is that this ETF and funds will systematically sell out of popular stocks into stocks that were historically neglected. If you are aware of this phenomenon, you could position well to take advantage of it.
Most of the momentum funds rebalance in March, and that has come and go. Now, we know the IT sector have not been performing well and the financial stocks have been performing well. Personally, I am not sure how much of these performances is due to these fund flows.
I think things might be a bit messy. While there are a lot of momentum funds out there, there might be more value funds than momentum funds. The fund flows from those value funds might be more meaningful than the momentum funds.
However, losing the support of fund inflows from these ETFs for the IT and consumer discretionary sector may contribute to the recent lacklustre performance.
IWMO rebalances at the end of May, which is a few days ago.
I regreted not downloading the 300 stocks that made up the ETF before the rebalancing (yes, if you go to each ETF home page, you can see the whole slew of stocks the ETF invests in)
But nevertheless, here is the sector composition of IWMO before and after the rebalancing:
| Before | Composition | After | Composition |
| Information Technology | 34% | Financials | 28% |
| Consumer Discretionary | 18% | Information Technology | 22% |
| Communication | 15% | Industrials | 13% |
| Industrials | 11% | Consumer Discretionary | 12% |
| Health Care | 10% | Communication | 11% |
| Materials | 4% | Materials | 5.9% |
| Financials | 3% | Energy | 3.5% |
| Consumer Staples | 1.7% | Health Care | 3.2% |
| Utilities | 1.6% | Consumer Staples | 1.1% |
| Real Estate | 0.7% | Cash and Derivates | 0.5% |
| Cash and Derivates | 0.2% | ||
| Energy | 0.1% |
There was indeed a big swing with financials now holding the largest composition. Materials and energy were also more meaningful but information technology still hold a significant chunk.
Here is how the top 10 holding change:
| Before | Composition | After | Composition |
| Tesla | 5.6% | Apple | 4.8% |
| Microsoft | 5.1% | Tesla | 3.5% |
| Amazon | 4.8% | JP Morgan | 3.0% |
| Apple | 4.8% | Alphabet C | 2.6% |
| 3.8% | ASML | 2.5% | |
| Nvidia | 3.4% | Alphabet A | 2.4% |
| Alphabet C | 3.0% | Berkshire | 2.3% |
| Alphabet A | 2.9% | Disney | 2.1% |
| Paypal | 2.3% | Bank of America | 2.1% |
| Adobe | 1.6% | LVMH | 1.8% |
The index lost Microsoft, Amazon, Facebook, Paypal and Adobe which have largely gone sideways and gain JP Morgan, ASML, Berkshire, Disney, LVMH and Bank of America.
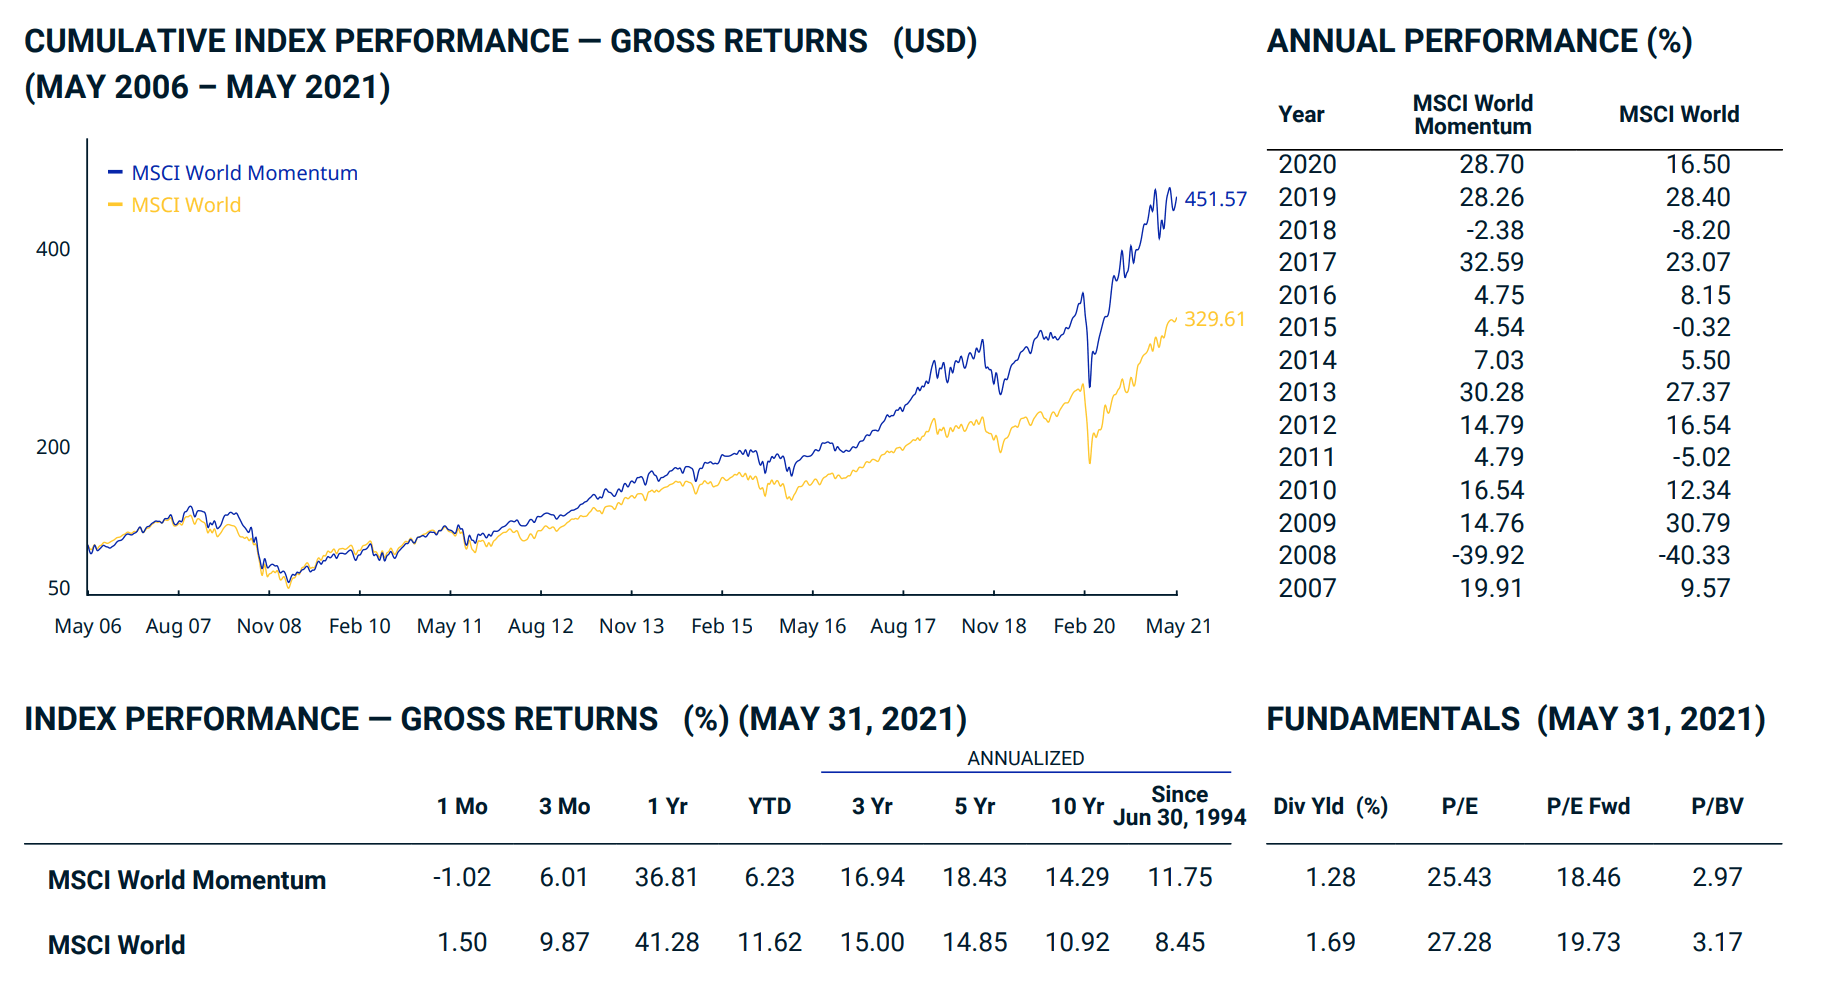
This rebalance severely reduces the Price Earnings of the index so much as lower than the MSCI World.
Here is the price charts for the top 10 stocks currently. I have inserted vertical lines to represent roughly the price that is 12-1 month and 6-1 month away.

Even though its performance stalled if we compared the 6-1 month performance, remarkably Apple is still the one with the largest allocation.
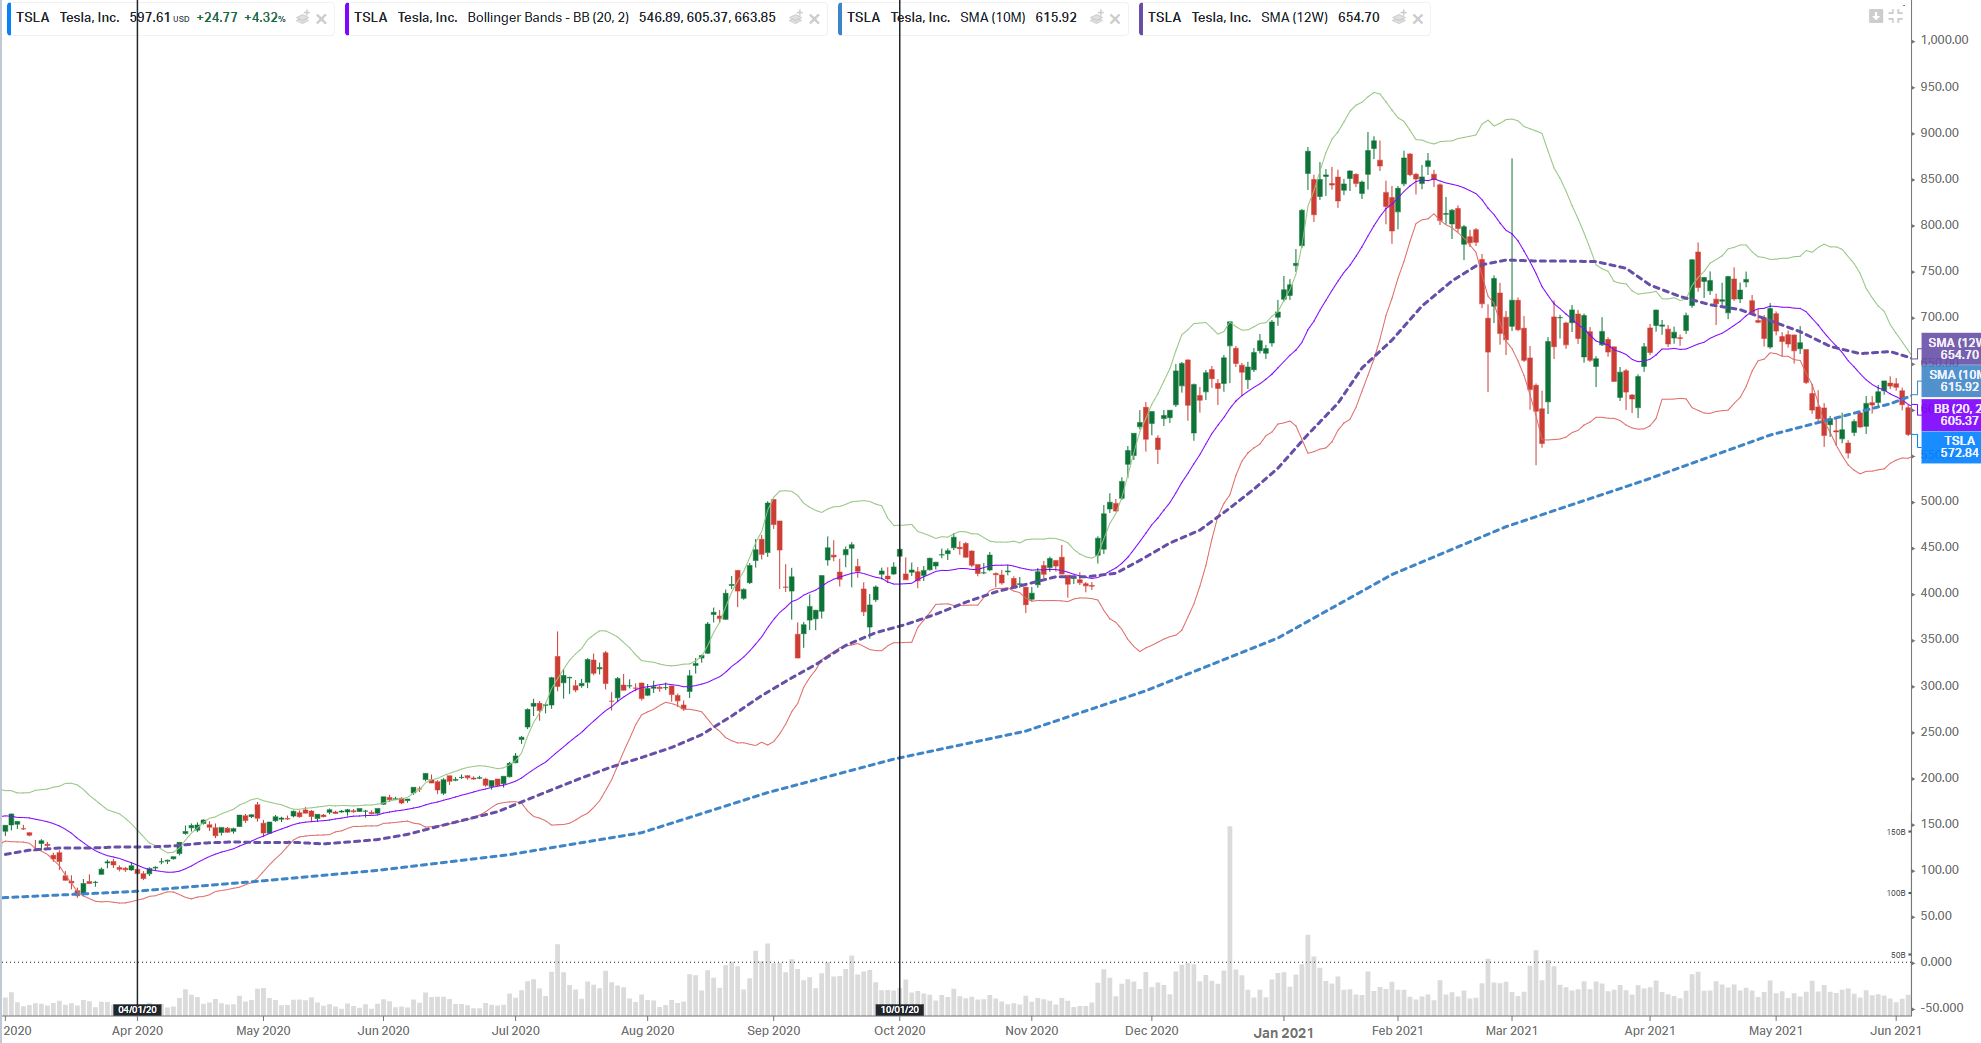
Despite the steep correction, Tesla still scores pretty well.
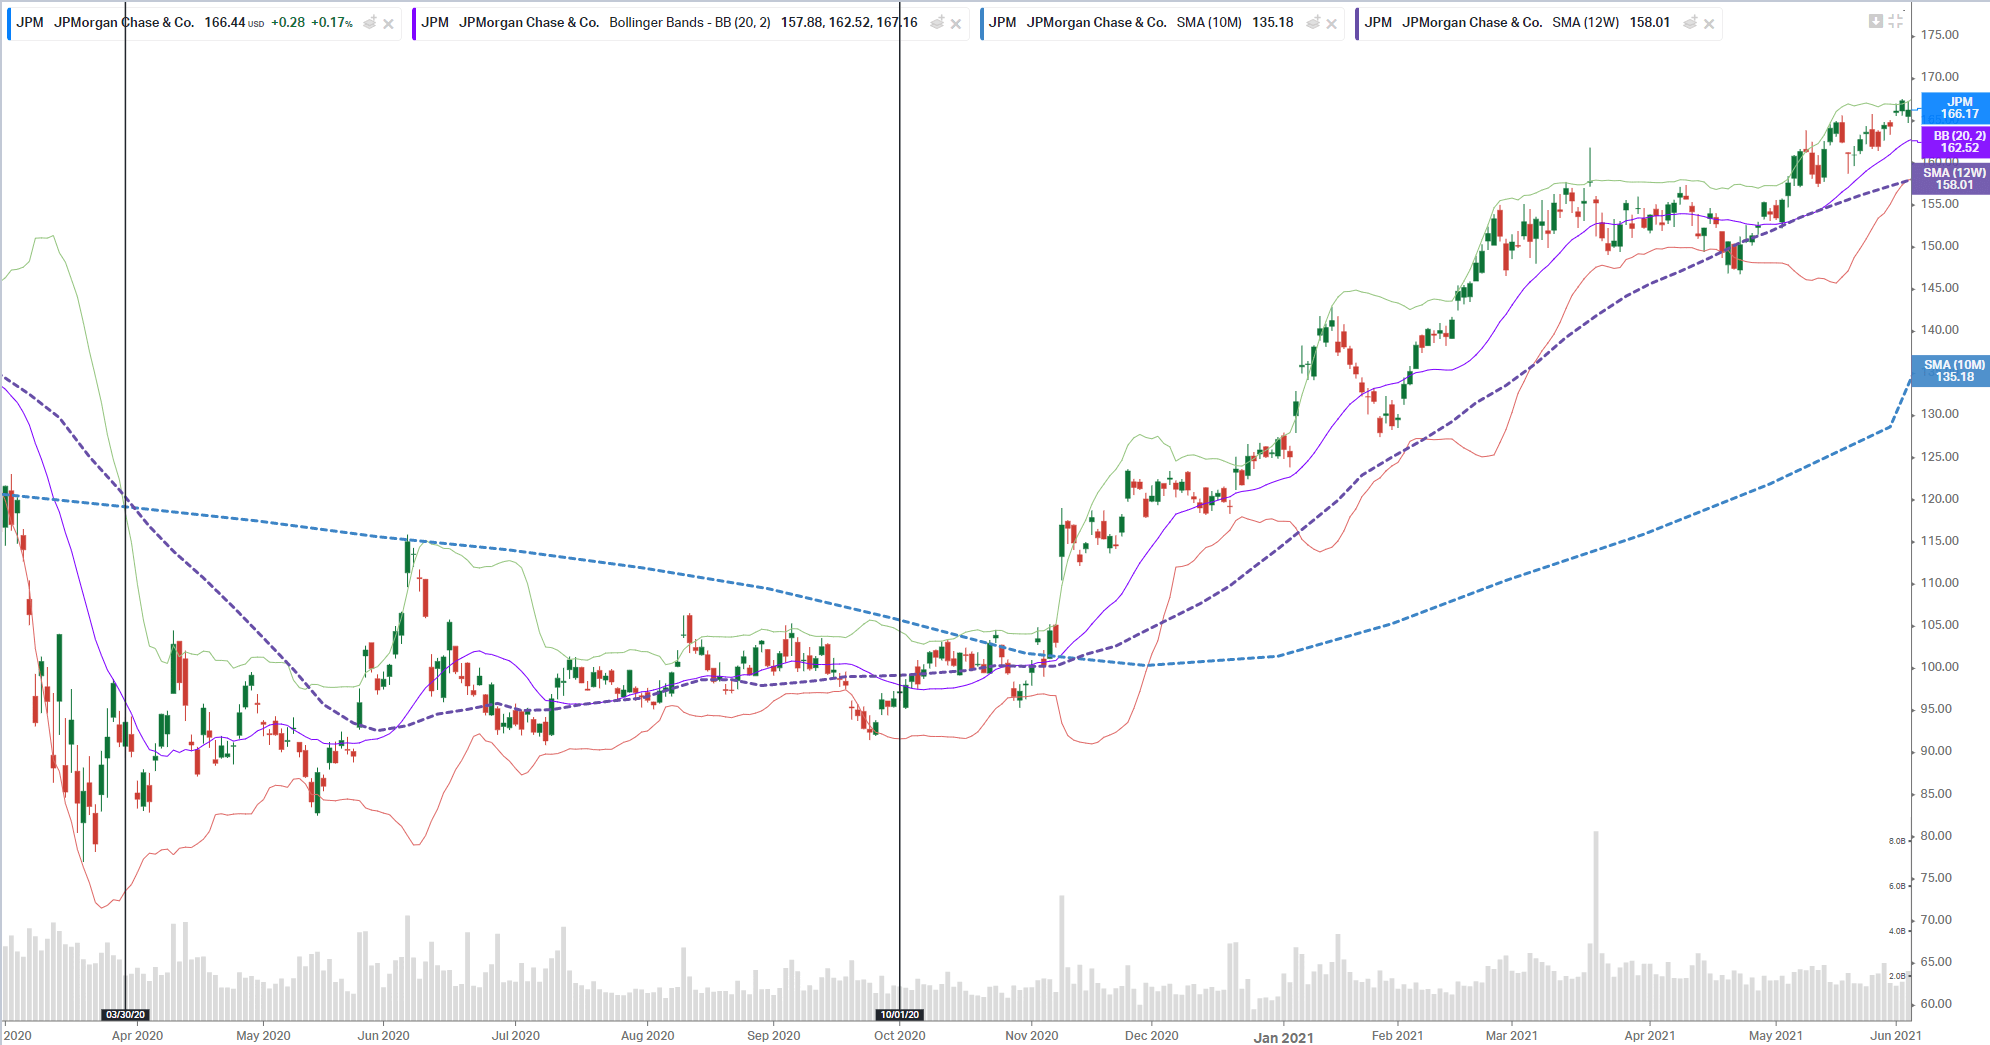
A finance company that made the list.
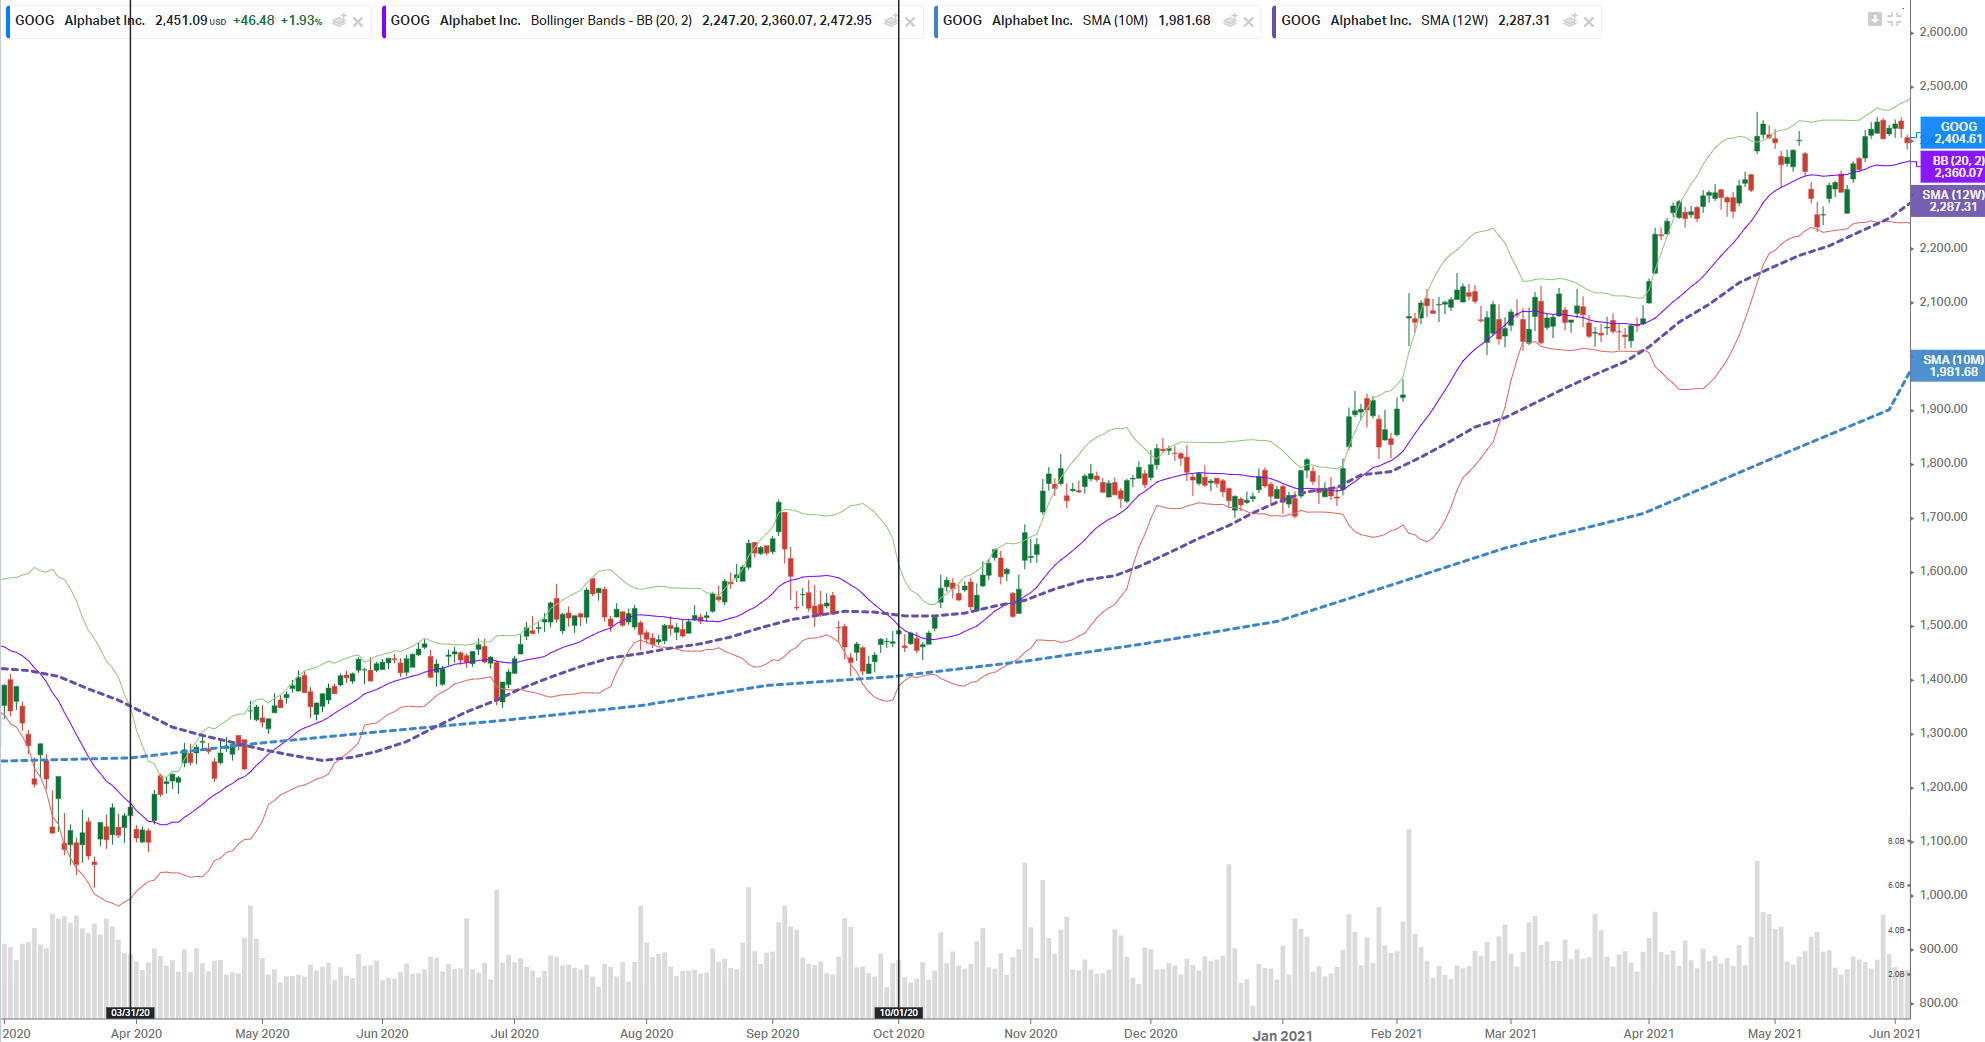
Google continues to do well even after the six month evaluation.

ASML was classified as an information technology stock.
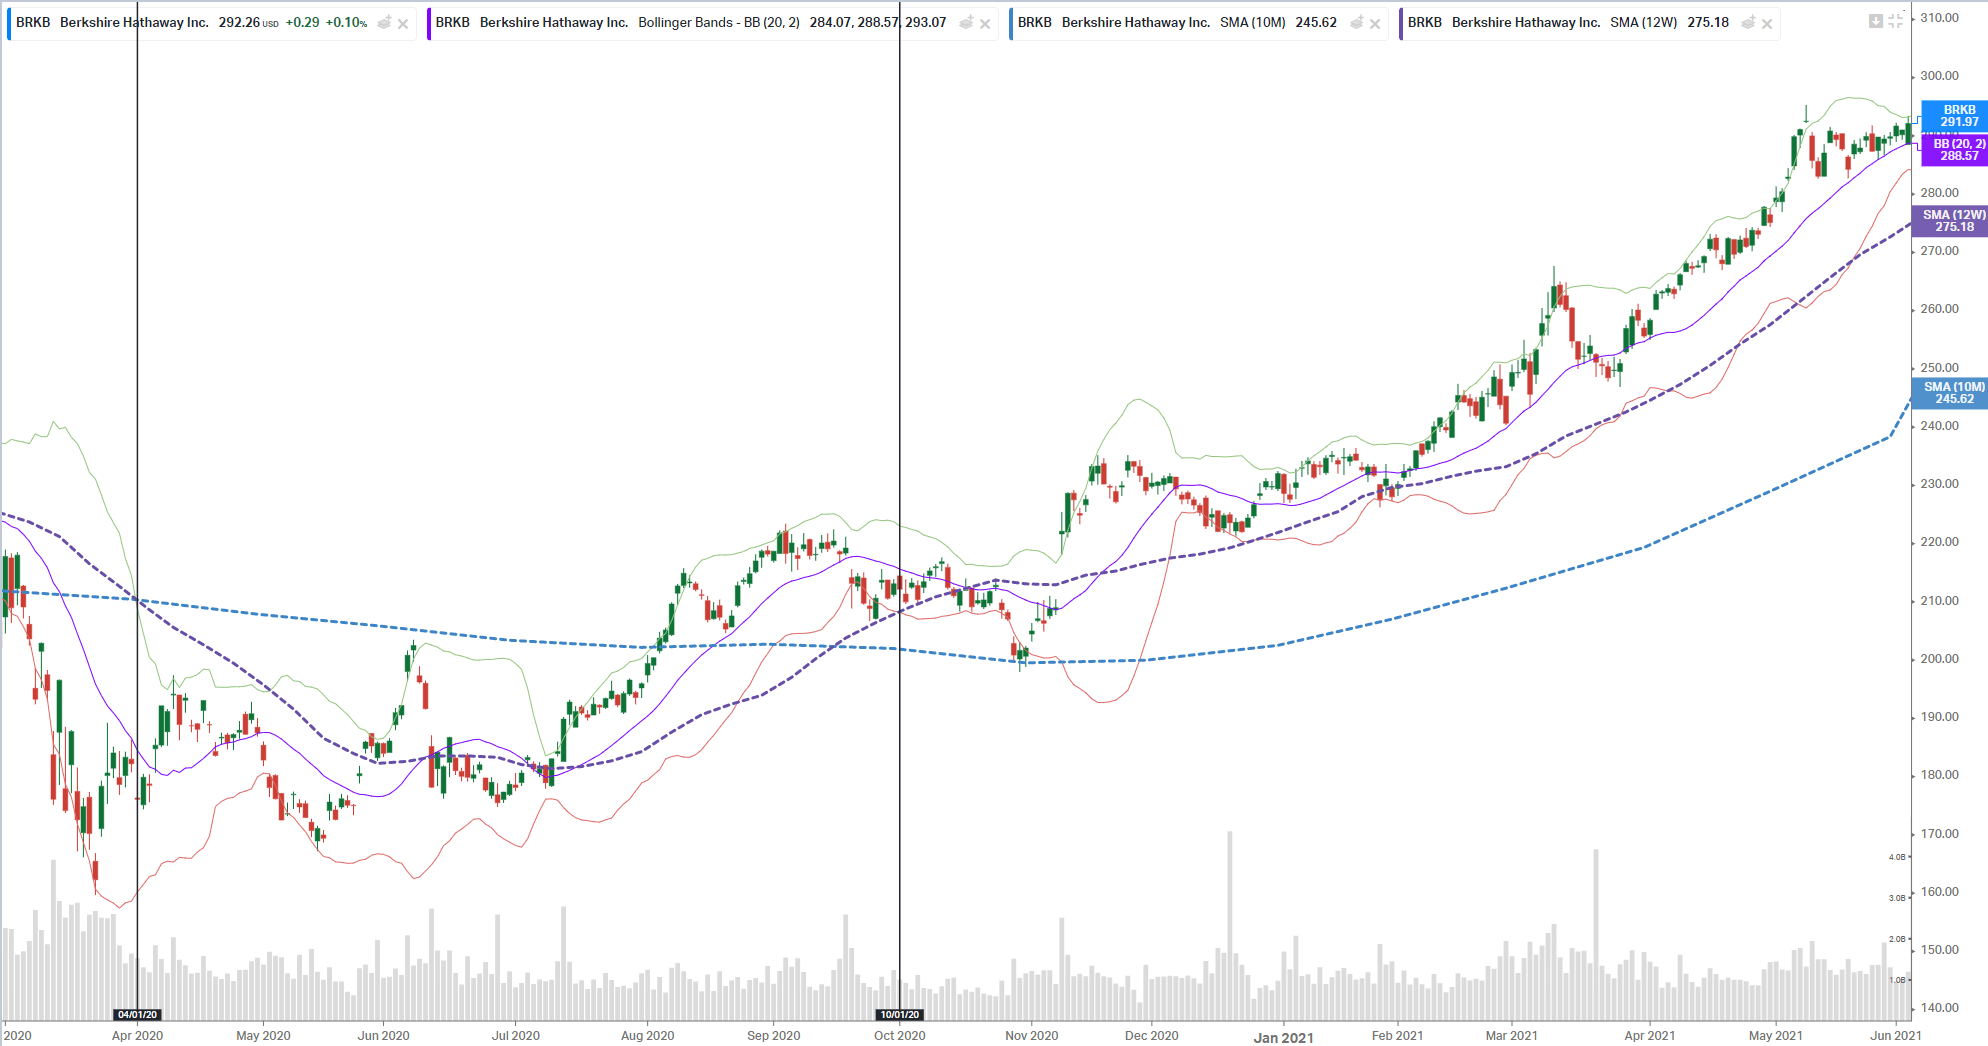
Berkshire is classified as a finance company that made the list.
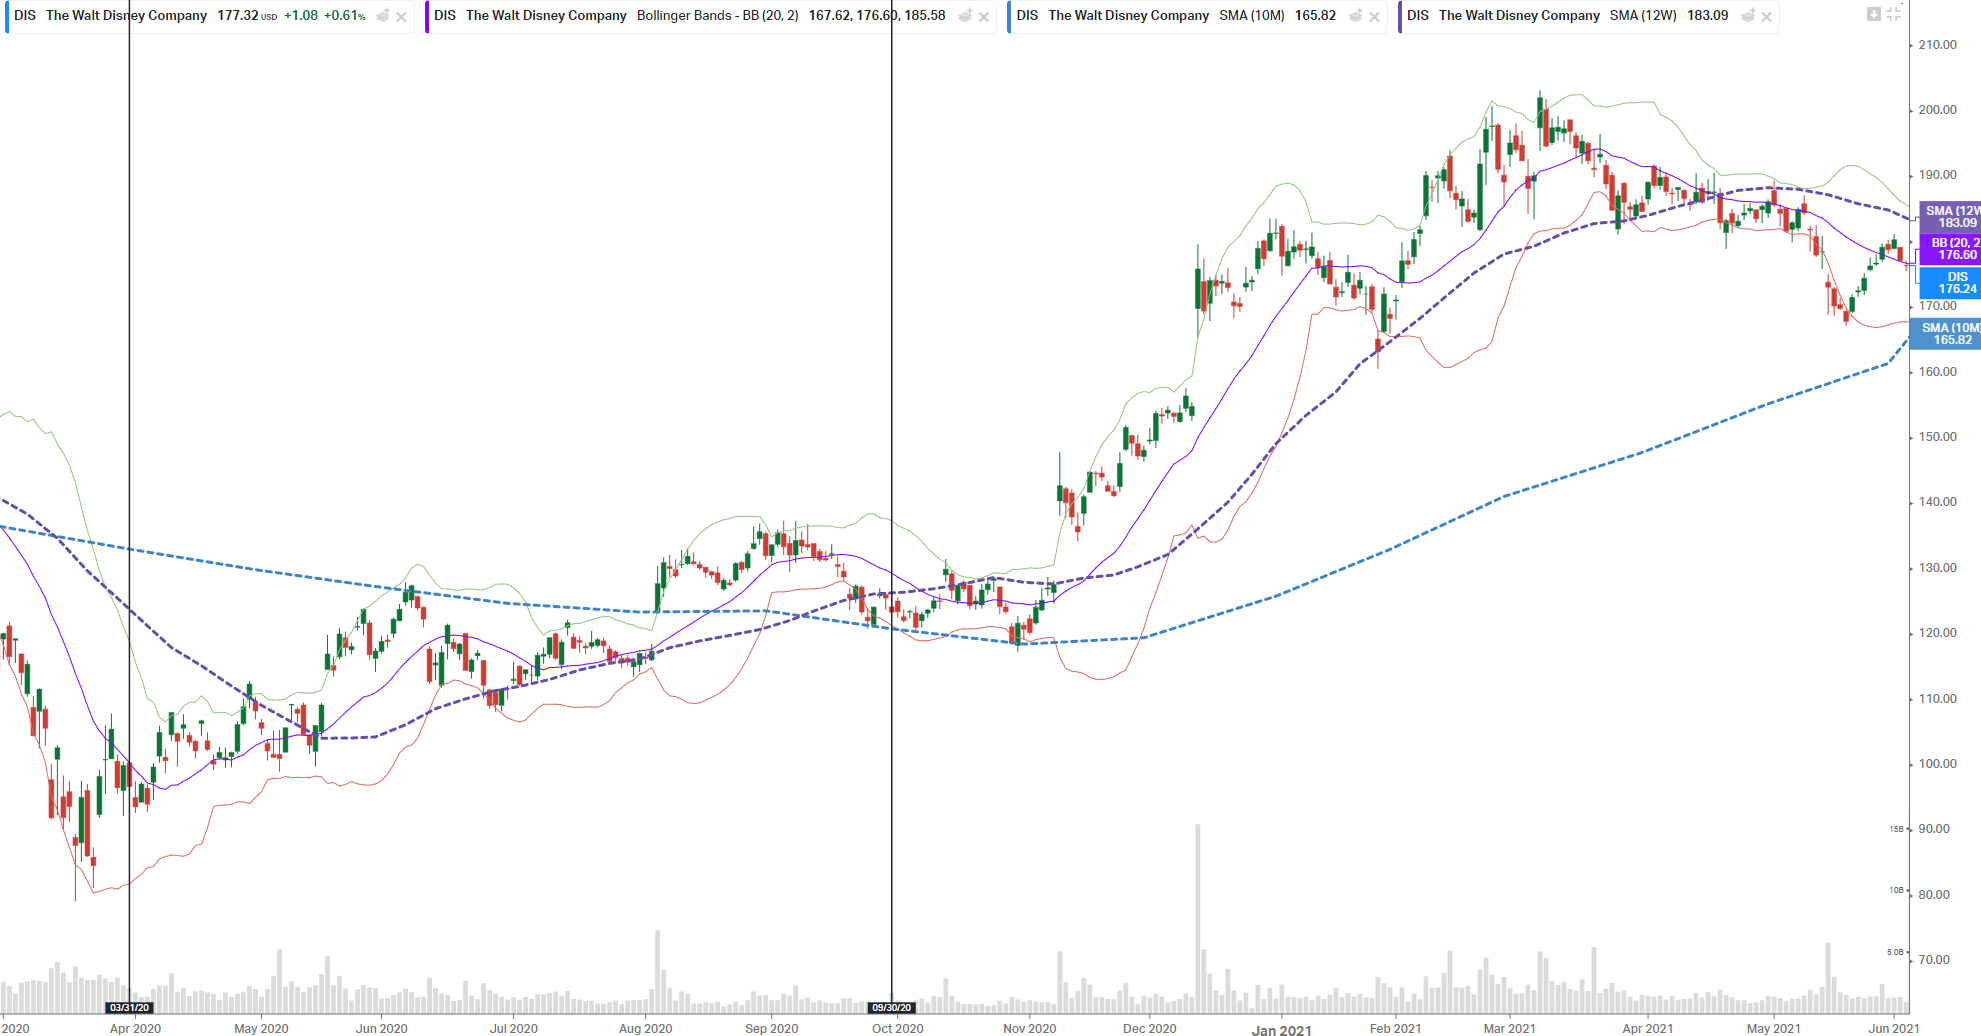
Walt Disney is classified as a communications company.

Another strong financial company.
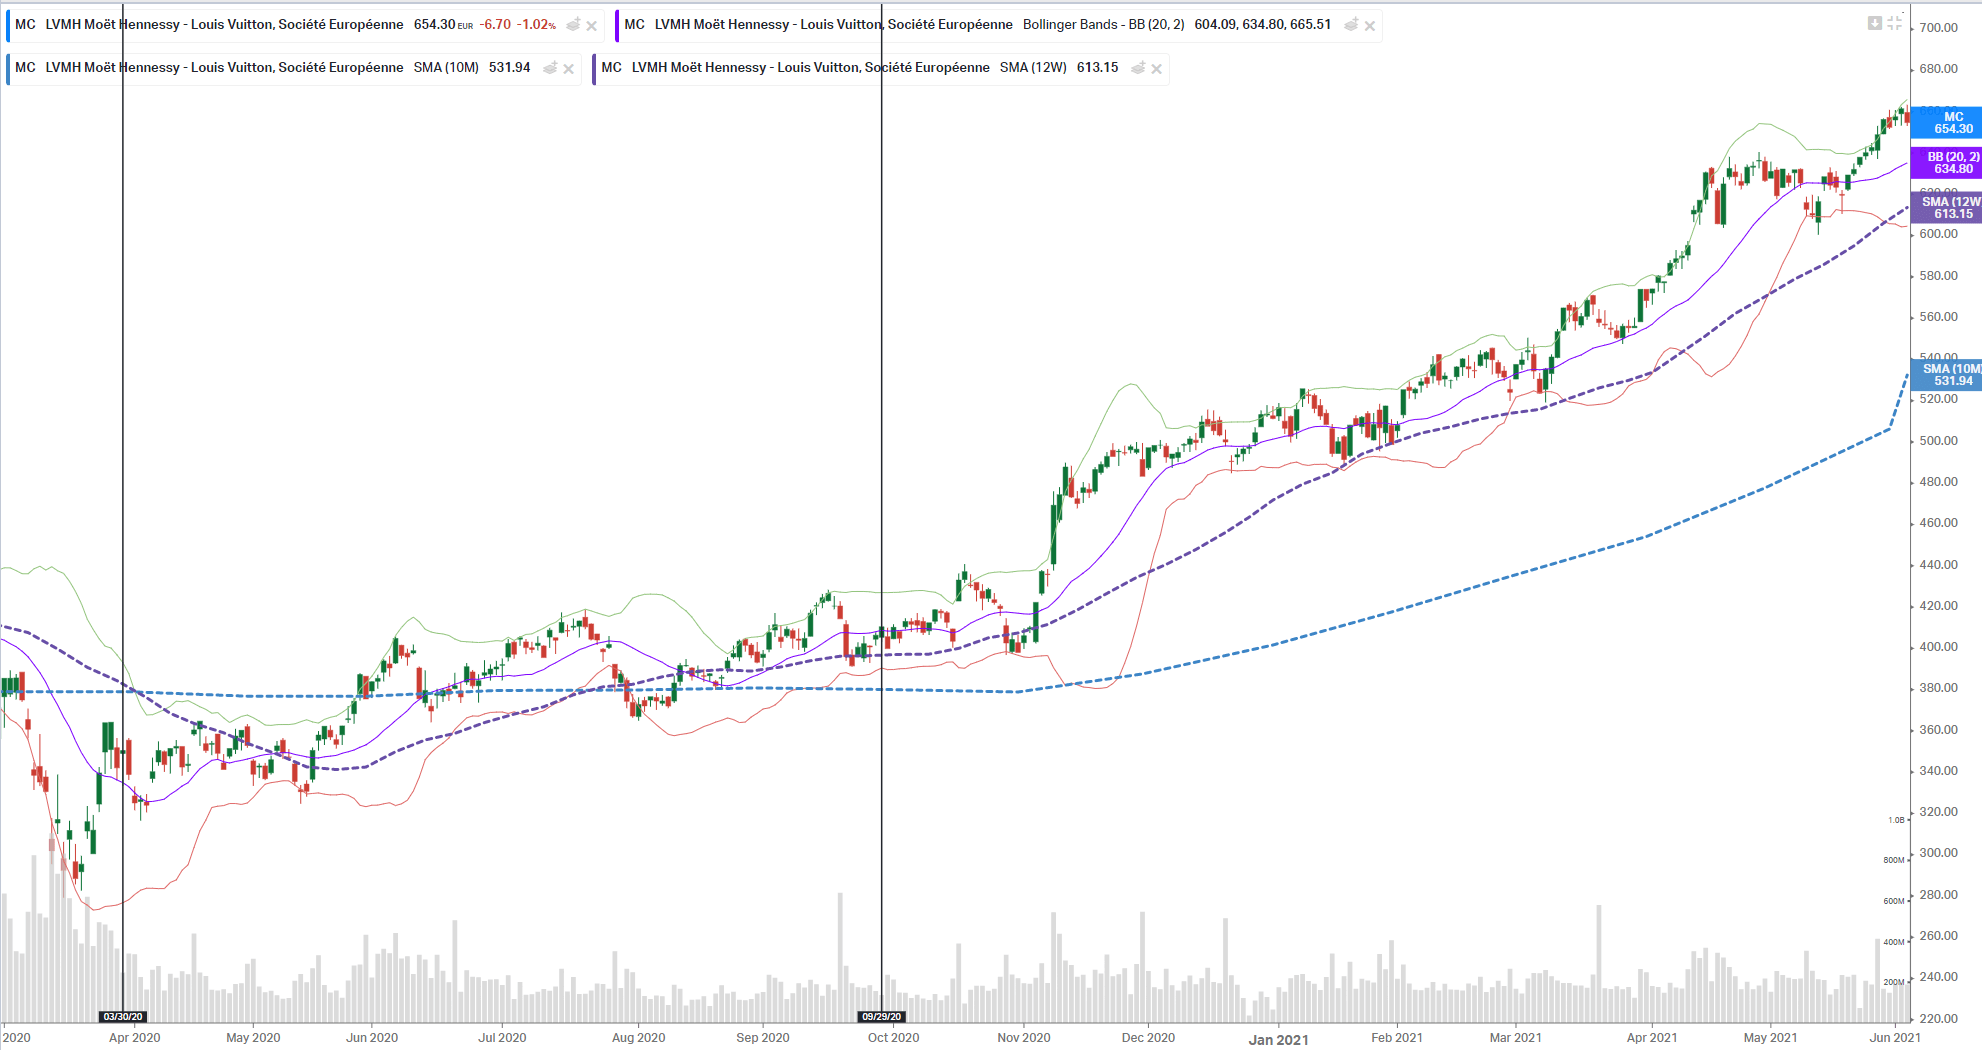
The only international company and consumer discretionary company that made it to the top 10.
Investing in a Momentum Style ETF Requires Particular Understanding of Factor Investing and Investing for the Long Term
You might wonder if this good performance in energy and financials would proved short-lived again.
I have my own mis-givings since I also have an active individual stock investor brain.
Investing in such a factor style ETF requires you to have enough conviction based on the research, that it will continue to work in the future.
There will be periods where the premium does not appear. The momentum factor did well in the past decade but if you take a look at it in the 1990s, it looked as bad as the value factor during the past decade.
And these factors will appear out of nowhere and to capture the premium, you got to remain invested.
While in general, most managers say you cannot time the factors, certain style work better in certain economic regimes (expansion, slowdown, contraction, recovery)
Momentum tends to work best when the markets are in expansion and before the recession. They suck when coming out of recession (Covid was a special period where the momentum stocks were the benefactor!)
I do have a few other data-driven Index ETF articles. These are suitable if you are interested in constructing a low-cost, well-diversified, passive portfolio.
You can check them out here:
- IWDA vs VWRA – Are Significant Performance Differences Between the Two Low-Cost ETFs?
- The Beauty of High Yield Bond Funds – What the Data Tells Us
- Searching for Higher Yield in Emerging Market Bonds
- The performance of investing in stocks that can Grow their Dividends for 7/10 years
- Should We Add MSCI World Small-Cap ETF (WSML) to Our Passive Portfolio?
- Review of the LionGlobal Infinity Global – A MSCI World Unit Trust Available for CPF OA Investment
- 222 Years of 60/40 Portfolio Shows Us Balanced Portfolio Corrections are Pretty Mild
- Actively managed funds versus Passive Peers Over the Longer Run – Data
- International Stocks vs the USA before 2010 – Data
- S&P 500 Index vs MSCI World Index Performance Differences Over One and Ten Year Periods – Data
Here are some supplements to sharpen your edge on low-cost, passive ETF investing:
Those who wish to set up their portfolio to capture better returns believe that certain factors such as value, size, quality, momentum and low volatility would do well over time and are willing to harvest these factors through ETFs and funds over time, here are some articles to get you started on factor investing passively:
- Introduction to factor investing / Smart Beta investing.
- IFSW – The iShares MSCI World Multi-factor ETF
- IWMO – The iShares MSCI World Momentum ETF
- GGRA – The WisdomTree Global Quality Dividend Growth UCITS ETF
- Investing in companies with strong economic moats through MOAT and GOAT.
- Robeco’s research into 151 years of Low Volatility Factor – Market returns with lower volatility that did well in different market regimes
- JPGL vs IFSW vs Dimensional Global Core vs SWDA – 22 years of 5-year and 10-year Rolling Returns Performance Comparison
- 98 Years of Data Shows the US Small Cap Value Premium over S&P 500
- 42 Years of data shows that Europe Small Cap Value premium over MSCI Europe
If you want to trade these stocks I mentioned, you can open an account with Interactive Brokers. Interactive Brokers is the leading low-cost and efficient broker I use and trust to invest & trade my holdings in Singapore, the United States, London Stock Exchange and Hong Kong Stock Exchange. They allow you to trade stocks, ETFs, options, futures, forex, bonds and funds worldwide from a single integrated account.
You can read more about my thoughts about Interactive Brokers in this Interactive Brokers Deep Dive Series, starting with how to create & fund your Interactive Brokers account easily.
I invested in a diversified portfolio of exchange-traded funds (ETF) and stocks listed in the US, Hong Kong and London.
My preferred broker to trade and custodize my investments is Interactive Brokers. Interactive Brokers allow you to trade in the US, UK, Europe, Singapore, Hong Kong and many other markets. Options as well. There are no minimum monthly charges, very low forex fees for currency exchange, very low commissions for various markets.
To find out more visit Interactive Brokers today.
Join the Investment Moats Telegram channel here. I will share the materials, research, investment data, deals that I come across that enable me to run Investment Moats.


Do Like Me on Facebook. I share some tidbits that are not on the blog post there often. You can also choose to subscribe to my content via the email below.
I break down my resources according to these topics:
- Building Your Wealth Foundation – If you know and apply these simple financial concepts, your long term wealth should be pretty well managed. Find out what they are
- Active Investing – For active stock investors. My deeper thoughts from my stock investing experience
- Learning about REITs – My Free “Course” on REIT Investing for Beginners and Seasoned Investors
- Dividend Stock Tracker – Track all the common 4-10% yielding dividend stocks in SG
- Free Stock Portfolio Tracking Google Sheets that many love
- Retirement Planning, Financial Independence and Spending down money – My deep dive into how much you need to achieve these, and the different ways you can be financially free
- Providend – Where I used to work doing research. Fee-Only Advisory. No Commissions. Financial Independence Advisers and Retirement Specialists. No charge for the first meeting to understand how it works
- Havend – Where I currently work. We wish to deliver commission-based insurance advice in a better way.
Kyith is the Owner and Sole Writer behind Investment Moats. Readers tune in to Investment Moats to learn and build stronger, firmer wealth foundations, how to have a Passive investment strategy, know more about investing in REITs and the nuts and bolts of Active Investing.
Readers also follow Kyith to learn how to plan well for Financial Security and Financial Independence.
Kyith worked as an IT operations engineer from 2004 to 2019. Currently, he works as a Senior Solutions Specialist in Insurance Start-up Havend. All opinions on Investment Moats are his own and does not represent the views of Providend.
You can view Kyith's current portfolio here, which uses his Free Google Stock Portfolio Tracker.
His investment broker of choice is Interactive Brokers, which allows him to invest in securities from different exchanges all over the world, at very low commission rates, without custodian fees, near spot currency rates.
You can read more about Kyith here.
- My Dividend Experience Investing in UCITS iShares iBond Maturing in 2028. - April 23, 2024
- We Invest into Popular Funds When They Are Popular, Exactly When They Started Turning to Shxt. - April 22, 2024
- Meal Prep 2.0 – Cooking Your “Go-to” Meal that You Look Forward to Eating Everyday. - April 21, 2024
Jérémie
Sunday 8th of August 2021
Hi Kyith, i would like to know where did you find how iShares ranks his momentum ETF ? Thanks.
Kyith
Monday 9th of August 2021
Hi Jeremie, what do you mean how iShares ranks his momentum ETF?