I always wonder why people say the 60/40 balanced portfolio is dead.
But for most people, a low-cost balanced portfolio should be the default investment option instead of a low-cost 100% global stock exchange-traded fund (ETF) or unit trust because it plays enough defence to keep you in the wealth-building game.
The 60/40 portfolio is short for a portfolio made up of 60% equity and 40% bonds. The equity and bonds can consist of different types of equity and bonds, but it is generally an allocation that people point to for investors with a moderate risk appetite.
There should likely be some strange history as to why the 60/40 is more popular than a more OCD 50/50 allocation.
Bonds have been around for a long time and so have equities. We would have seen it if this portfolio didn’t work so well.
In my research on sustainable retirement income with the safe withdrawal rate (you can read the importance of the safe withdrawal rate for financial independence here), I showed enough data that a 60/40 allocation is decent for your retirement. A 100% equity allocation may not always be better than an 80% equity allocation for retirement income. The critical fact is that we have 150 years of equity and bond data in the retirement income sustainability study.
The Man Institute put out some startling data last week about the 60/40 portfolio allocation.
By using the data from Shiller and GFD database, we have 222 years of equity and bond data going back to 1800.
Here is something startling:
The first half of 2022 was the second worst first-half performance for 60/40 in more than 200 years.
In 79% of years of the 60/40 portfolio, it was positive for the year’s first half. This first half was not one of those.
The chart below tabulates the best and worst 5-year periods of the US 60/40 portfolios for the past 222 years:
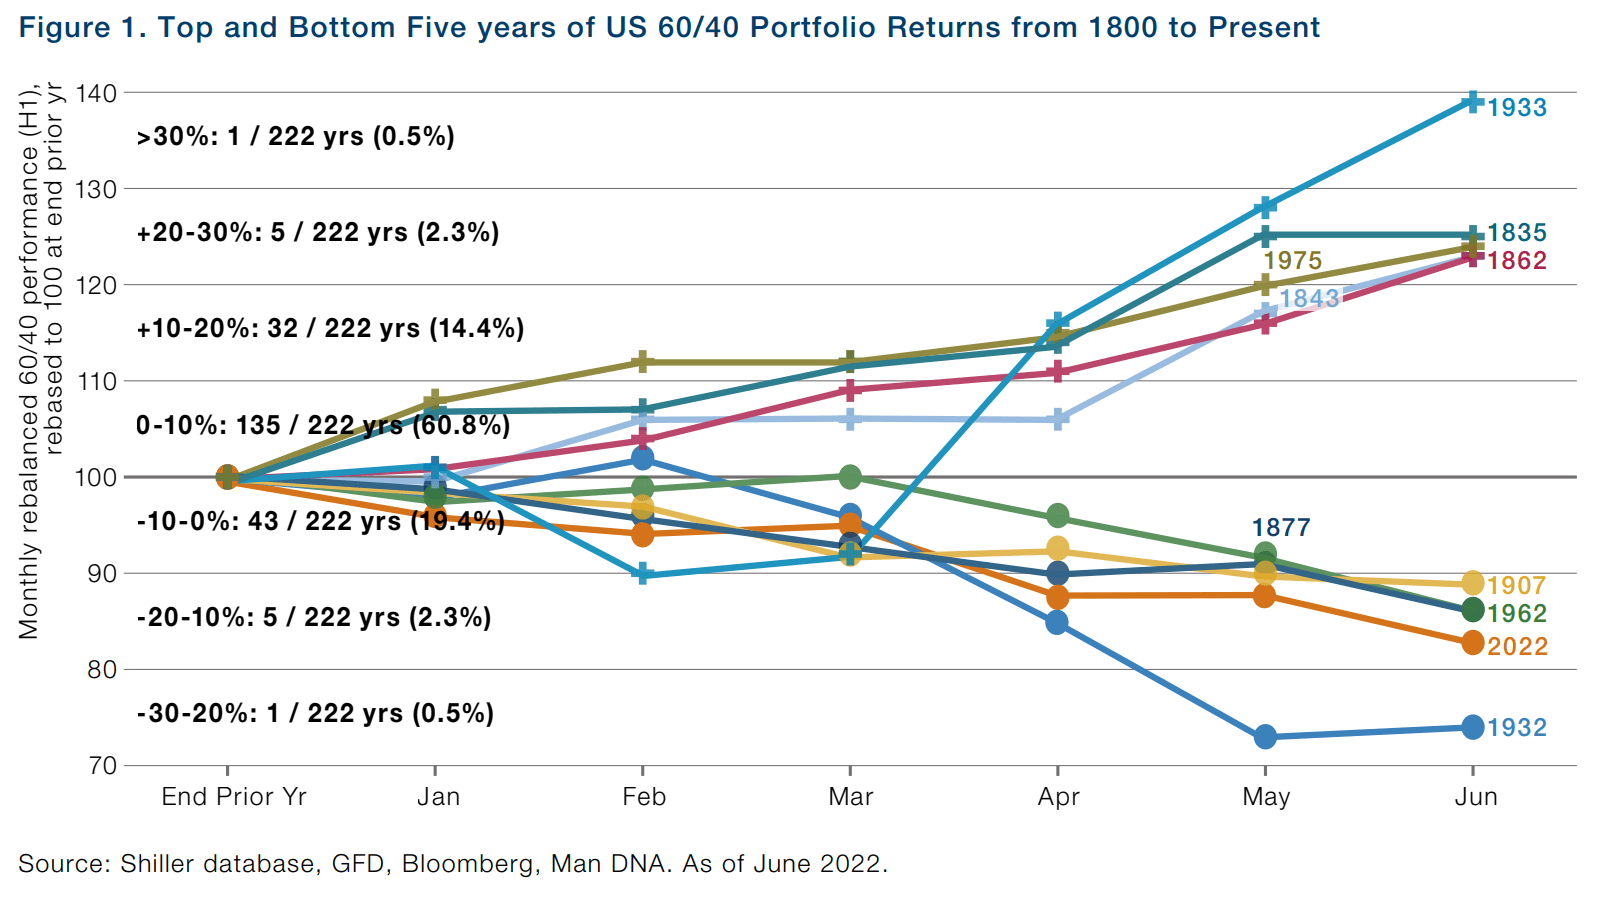
You can see the first half of 2022 in the history books.
Look at the black data next to the chart:
- 61% of the time, the first-half performance was between 0 to 10%
- 14% of the time, it did 10-20% and 20%, it did 0 to -10%
- it is less common to do 20-30%
- it only did greater than 30% once
- it fell between 10% to 20% only 5 times
- and more than 20% once
I don’t know about you, but you got to ask yourself: What is today different from the past 222 years that will constitute the 60/40 dead?
Man’s data show that when the fall is significant, the bounce back also tends to be significant:
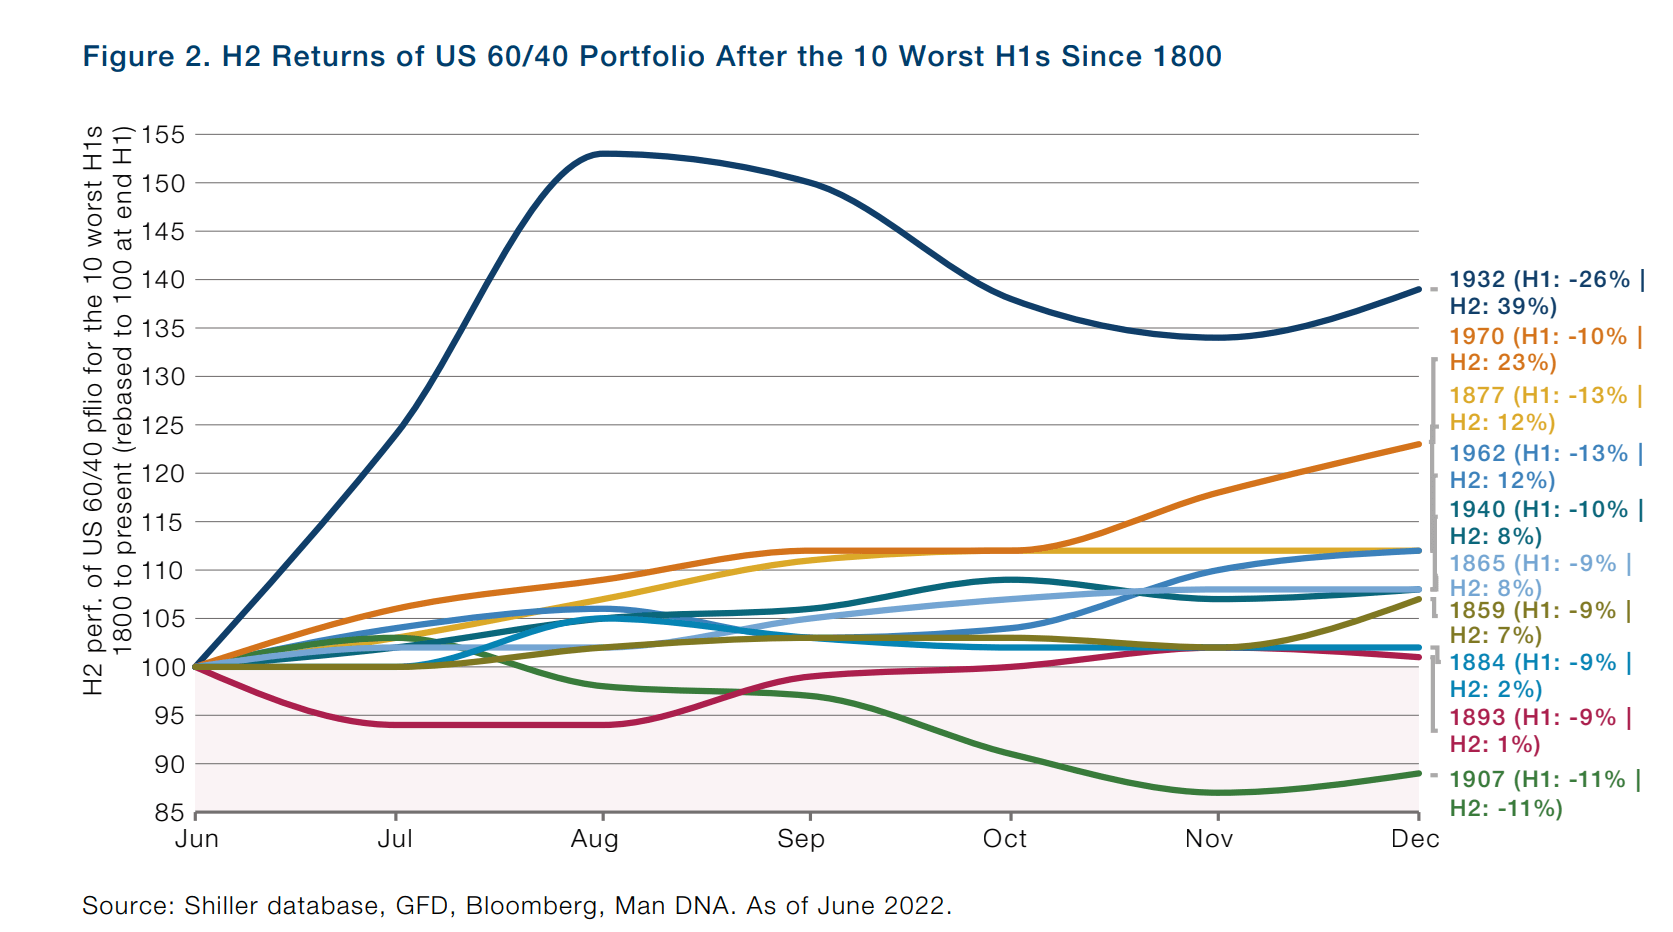
The most depressing downturn was 1932, and the second half did 39%.
1962 was the second most atrocious downturn. It did -13% in the first half.
-13% is the second worst first-half performance in 222 years before this.
My takeaway was not how strong was the bounce back. We could end up similar to 1907, and there wasn’t a bounce back as strong.
But we know the future expected returns for bonds and equities were positive after 1907, and the market came back. What was more critical was how psychologically manageable was the degree of drawdowns.
The chart above lists the ten worst first half 60/40 drawdowns: -26%, -13% (x2), -11%, -10% (x2), -9% (x 4).
They are relatively livable for most investors.
I want investors to note the two significant caveats: These are long-term US government bonds, not any kind of bonds. If you use your emerging market bonds or high yield bonds, your mileage would significantly be different.
The second thing is this is the first half of the year, but if you include the data for the full year, it might look somewhat different.
Just for your benefit, I went about to tally the worst full-year performance for US 60/40 portfolio:
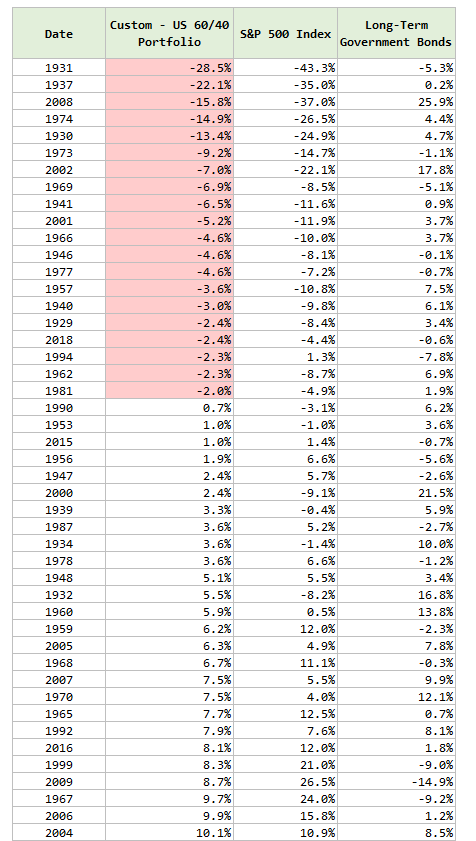
I have only data going back to 1926, which gives us 93 years of data (or one century less). You can observe what kind of magnitude would be considered a bad year for a 60/40 portfolio and why you would have bonds in the portfolio.
I would say the down years in 1973, 1974 and 1977 feel much worse due to the inflation rate.
Equity and Bonds Are More Positively Correlated Than We Think
The returns data above should clarify how well a balanced portfolio performed amidst different economic regimes in the past.
However, commentators lament that the negative correlation between equity and bonds has been broken. In recent months, stocks and bonds have moved in the same direction (down).
AQR recently published a piece on the Stock and Bond Correlation:
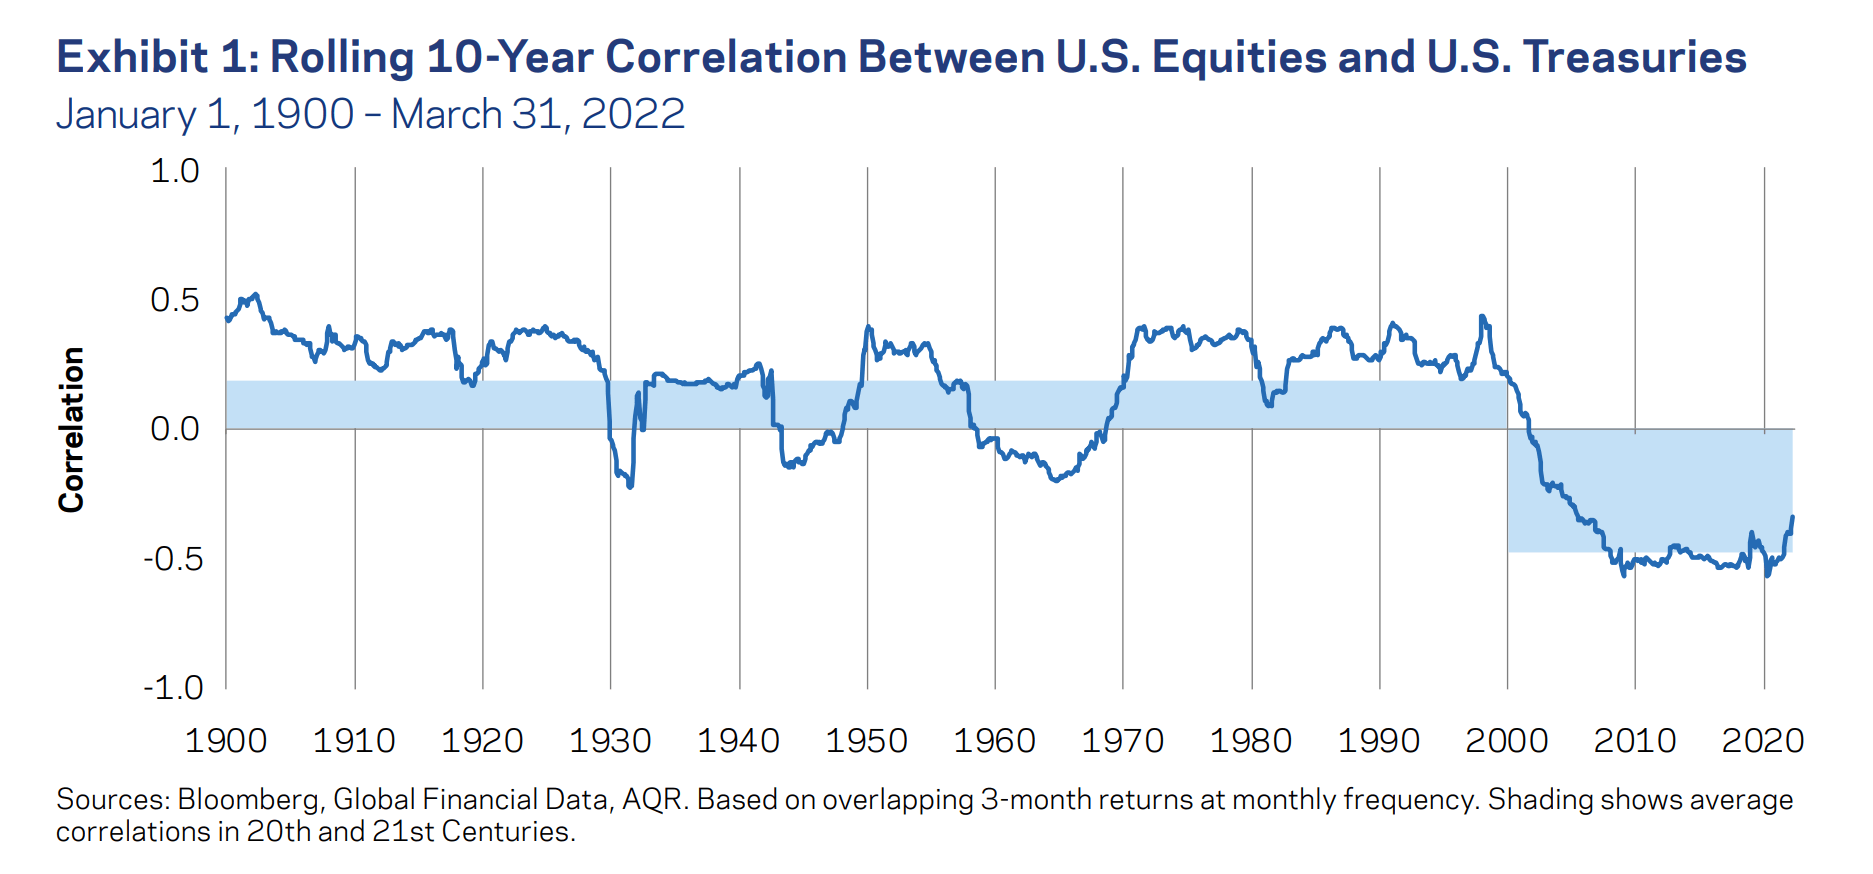
They presented the 10-year rolling correlation between US equities and treasuries over the past 122 years.
Observe that a 10-year positive correlation between stocks and bonds is more the norm than a rarity.
What is uncommon is the recent prolonged negative correlation.
All this stuff has happened through the same past two centuries, and you got to wonder what could be different this time round that is different from those years that we have not seen before.
Perhaps it is the very low interest rates, but this is not new either:

Interest rates have always been volatile and have recovered somewhat to the lower bound.
How you should see bonds is to craft a portfolio so that you can stay in the game better. It acts as a dampener for your portfolio. To put it in another way, most of us cannot live with a 100% equity portfolio for the majority of our net worth.
I do have a few other data-driven Index ETF articles. These are suitable if you are interested in constructing a low-cost, well-diversified, passive portfolio.
You can check them out here:
- IWDA vs VWRA – Are Significant Performance Differences Between the Two Low-Cost ETFs?
- The Beauty of High Yield Bond Funds – What the Data Tells Us
- Searching for Higher Yield in Emerging Market Bonds
- The performance of investing in stocks that can Grow their Dividends for 7/10 years
- Should We Add MSCI World Small-Cap ETF (WSML) to Our Passive Portfolio?
- Review of the LionGlobal Infinity Global – A MSCI World Unit Trust Available for CPF OA Investment
- 222 Years of 60/40 Portfolio Shows Us Balanced Portfolio Corrections are Pretty Mild
- Actively managed funds versus Passive Peers Over the Longer Run – Data
- International Stocks vs the USA before 2010 – Data
- S&P 500 Index vs MSCI World Index Performance Differences Over One and Ten Year Periods – Data
Here are some supplements to sharpen your edge on low-cost, passive ETF investing:
Those who wish to set up their portfolio to capture better returns believe that certain factors such as value, size, quality, momentum and low volatility would do well over time and are willing to harvest these factors through ETFs and funds over time, here are some articles to get you started on factor investing passively:
- Introduction to factor investing / Smart Beta investing.
- IFSW – The iShares MSCI World Multi-factor ETF
- IWMO – The iShares MSCI World Momentum ETF
- GGRA – The WisdomTree Global Quality Dividend Growth UCITS ETF
- Investing in companies with strong economic moats through MOAT and GOAT.
- Robeco’s research into 151 years of Low Volatility Factor – Market returns with lower volatility that did well in different market regimes
- JPGL vs IFSW vs Dimensional Global Core vs SWDA – 22 years of 5-year and 10-year Rolling Returns Performance Comparison
- 98 Years of Data Shows the US Small Cap Value Premium over S&P 500
- 42 Years of data shows that Europe Small Cap Value premium over MSCI Europe
I invested in a diversified portfolio of exchange-traded funds (ETF) and stocks listed in the US, Hong Kong and London.
My preferred broker to trade and custodize my investments is Interactive Brokers. Interactive Brokers allow you to trade in the US, UK, Europe, Singapore, Hong Kong and many other markets. Options as well. There are no minimum monthly charges, very low forex fees for currency exchange, very low commissions for various markets.
To find out more visit Interactive Brokers today.
Join the Investment Moats Telegram channel here. I will share the materials, research, investment data, deals that I come across that enable me to run Investment Moats.


Do Like Me on Facebook. I share some tidbits that are not on the blog post there often. You can also choose to subscribe to my content via the email below.
I break down my resources according to these topics:
- Building Your Wealth Foundation – If you know and apply these simple financial concepts, your long term wealth should be pretty well managed. Find out what they are
- Active Investing – For active stock investors. My deeper thoughts from my stock investing experience
- Learning about REITs – My Free “Course” on REIT Investing for Beginners and Seasoned Investors
- Dividend Stock Tracker – Track all the common 4-10% yielding dividend stocks in SG
- Free Stock Portfolio Tracking Google Sheets that many love
- Retirement Planning, Financial Independence and Spending down money – My deep dive into how much you need to achieve these, and the different ways you can be financially free
- Providend – Where I used to work doing research. Fee-Only Advisory. No Commissions. Financial Independence Advisers and Retirement Specialists. No charge for the first meeting to understand how it works
- Havend – Where I currently work. We wish to deliver commission-based insurance advice in a better way.
Kyith is the Owner and Sole Writer behind Investment Moats. Readers tune in to Investment Moats to learn and build stronger, firmer wealth foundations, how to have a Passive investment strategy, know more about investing in REITs and the nuts and bolts of Active Investing.
Readers also follow Kyith to learn how to plan well for Financial Security and Financial Independence.
Kyith worked as an IT operations engineer from 2004 to 2019. Currently, he works as a Senior Solutions Specialist in Insurance Start-up Havend. All opinions on Investment Moats are his own and does not represent the views of Providend.
You can view Kyith's current portfolio here, which uses his Free Google Stock Portfolio Tracker.
His investment broker of choice is Interactive Brokers, which allows him to invest in securities from different exchanges all over the world, at very low commission rates, without custodian fees, near spot currency rates.
You can read more about Kyith here.
- My Dividend Experience Investing in UCITS iShares iBond Maturing in 2028. - April 23, 2024
- We Invest into Popular Funds When They Are Popular, Exactly When They Started Turning to Shxt. - April 22, 2024
- Meal Prep 2.0 – Cooking Your “Go-to” Meal that You Look Forward to Eating Everyday. - April 21, 2024
Revhappy
Thursday 11th of August 2022
I personally believe the 40% bond component should be local. So for a non US investor, there is no point looking at US long duration bond data. We need to look at our country's fixed income data.
Sinkie
Wednesday 10th of August 2022
I think the main difference is the extreme globalisation i.e. cheap China stuff from 2000-2020.
Going forward, with de-globalisation, polarisation, geopolitical tensions, I think the world will be more like pre-1990.
Anyway if you believe in mean reversion, bonds will bounce back strongly within a year or so, and help stabilise 60/40 portfolios. But this bounce back can be due to bad stuff or good stuff, so outcomes for equities can be very different.