I was listening to a podcast last week and they brought on someone to talked about commercial real estate.
The guest shared some rather general ideas about CAP Rates and it occur to me that I didn’t write anything about it.
CAP Rates are a pretty common term in the property world.
If you own a property developer who owns investment properties, or a real estate investment trust (REIT), flip to the part where they value properties, and you can see them using CAP rates as a way of valuing a property.
But there are more to understand about CAP Rates:
- it is use to compare between properties, a portfolio of them or versus the specific market segment
- it could be affected by interest rates but in what way
- market CAP rates versus your property’s current CAP rates
- does it embed any growth factor into it?
This article is applicable if you are
- interested generally in real estate
- an investor in one local or overseas
- investor in property investment stocks
- real estate investment trusts (REITs) in general
I decided to quickly scribble something here.
What is the Un-leveraged Yield on Your Property
CAP Rate is short for Capitalization Rate. The capitalization rate is used in the world of commercial real estate to indicate the rate of return that is expected to be generated on a real estate investment property.
We always want a way to evaluate how much the property is fetching on the market but without a lot of the factors that varies from investor to investor.
This is why we compute the CAP Rate.
CAP Rate can be computed at different level:
- For the property / portfolio of properties you own
- For the segment of properties of similar nature in the market
#2 is usually done by some independent or commercial agency while #1 is usually done by yourself.
And in this article you can see CAP Rate being used in valuation, comparison.
Basically, it helps you in your evaluation whether this is a worthwhile investment to buy, hold or you should sell.
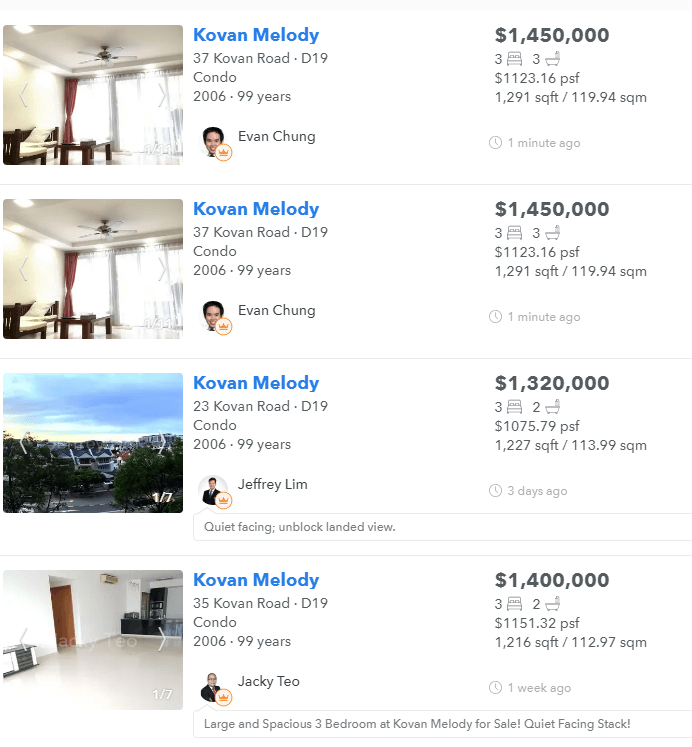
Suppose you are interested in a condo that is near Kovan MRT that is 3 bedroom. A screen shows you the set of condos that is around 1200 sqft. The average price is around $1.4 mil.
While you want to buy to live, you also do not want to buy at too high a price. It is also an investment to you. So you wish to see the performance of this as a rental.
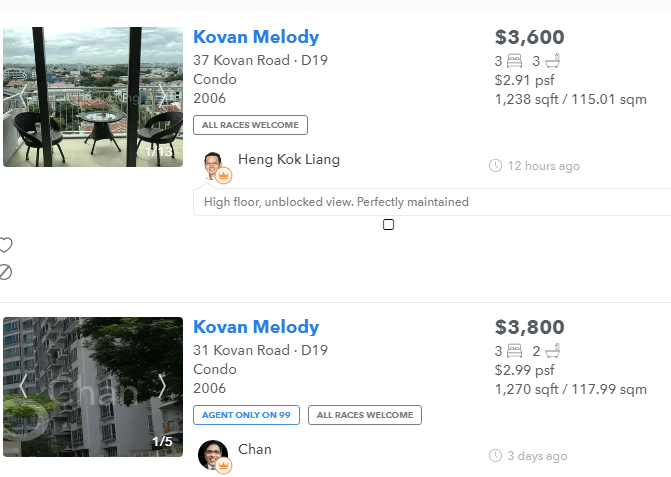
So you pulled up how much the same spec of condo rents for. It is about $3.7k/mth or $44.4k/yr (essentially these are listings and maybe it is best to check URA website to get the latest rental transactions, which might be more accurate). However, you should not be expecting there are no cost to this. You have to pay the agent fees, there will be vacancies and there are things to repair and touch up.
My real estate agent friend tells me that we typically estimate 10 months of rent as what you get after expenses. So in this case it will be $37k.
You get the CAP Rate of the Kovan Melody as $37,000/$1,400,000 = 2.64%
Is this a good performing asset to purchase? You would not know unless you find out what is the CAP Rate of the condos around Kovan. And for the matter in Singapore.
And this why folks are interested in CAP Rates:
- It can let you compare against less risky things like Singapore Government bonds, or other assets like REITs
- It enables you to see if you got a bargain deal, versus the general Kovan or Singapore Market.
How do We Compute the CAP Rate of a Specific Property?
To compute the CAP Rate you need to know:
- The Net Operating Income of the Specific Property or the Net Property Income of the Specific Property
- The Current Valuation of the Specific Property (without any leverage)
The Current Market CAP Rate of a Specific Property is derived by Net Operating Income or Net Property Income / Current Valuation of the Specific Property
What you get is the un-leveraged yield that the property is yielding at currently.
This is also known as the Current Net Property Income Yield or Current NPI Yield for short.
You can replaced #2 with the historical cost that you bought the property for.
Then, you can calculate the Historical CAP Rate of the Specific Property as Net Operating Income or Net Property Income / Historical Cost of the Specific Property
What you get is the un-leveraged yield that the original purchaser bought it at X years ago.
Calculating the Net Operating Income (NOI) or Net Property Income (NPI)
To me, Net Operating Income or Net Property Income means the same thing. I do not know why folks here always want to invent their own terms.
The NOI = The annual income generated by an income-producing property after taking into account all income collected from operations, and deducting all expenses incurred from operations.
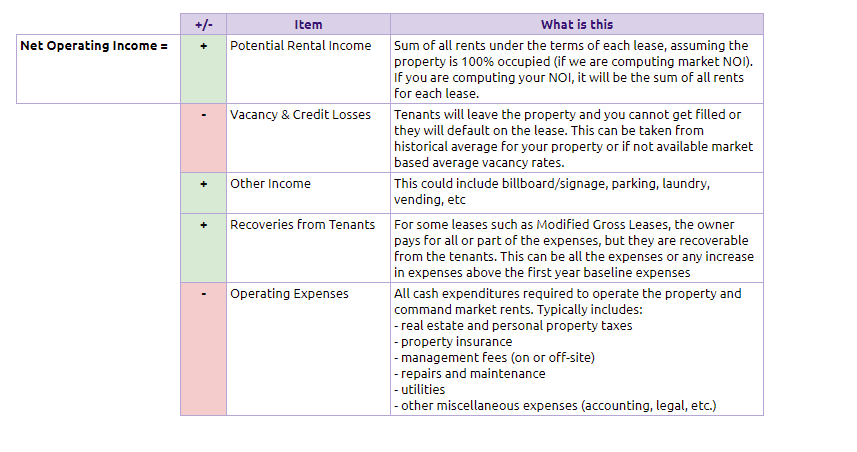
How to calculate NOI or NPI ( net property income)
The formula above shows us how do we calculate NOI or NPI.
Notice that since sometimes we are calculating the average market NPI and sometimes we are calculating the NPI of the property we purchased, the potential rental income and vacancy used can be rather different.
So you got to know what it entails in the first place.
What does not go into the NOI or NPI
To understand the NPI, some times it makes sense to know what does not go into the NPI:
1. Interest Expenses. The interest on your debt is not included. We do not know how much debt a potential owner will be willing to take so adding this in distorts things. This is why it is called un-leverage.
2. Depreciation. Depreciation is not actual cash flow, but rather an accounting entry, and thus it is not included in NOI computation.
3. Income Taxes. These are taxes specific to the owner or investor. We do not know whether the owner will enjoy or have disincentives in taxes so we do not include this.
4. Tenant Improvements. These are construction within a tenant’s usable space to make the space viable for their use. This is more specific to the lease
5. Capital Expenditures / Reserves for Replacement (subjective). These are funds set aside for major future maintenance items. These maintenance items are such as roof replacements, air conditioning repair if we talk about a single family home. For a commercial property this might be replacing the lobby area, doing an asset enhancements initiative like some of REITs do to improve the ambiance of the buildings so that the buildings can be more competitive to attract tenants.
Some question that you might have is how is this different from the maintenance included in the NOI computation above? I think if we want to boil down to the nuances, the maintenance over there would probably include the costs of keeping things functional, or repairing things to restore them to the original state. In other words, to upkeep things. Some examples could be that you get people to do yearly air conditional maintenance, toilet maintenance, fire alarm checks to ensure these things are functional.
In the case of the shopping centers, the office buildings, studies have shown that if you do an asset enhancement initiative (AEI) every 5 to 10 years, their buildings remained more competitive rather than if you do not do anything (a bit common sense here).
The subjective thing is that some valuers added this to their NOI computation. They would take how long before they need to do a major revamp, and divide the cost by number of years and add this to each years NOI computation.
In Singapore context, what I observe is that the property owners do not do it.
Rather, they look at these as something they could finance with debt, do it, and they can improve the value of the property. The value of the property gets improved because the expectations is that future rent is better.
NPI / NOI in Financial Statements of REITs
REITs are specialized property companies whose specific purpose is buy to rent.
So you will see them publishing figures like Net Property Income.
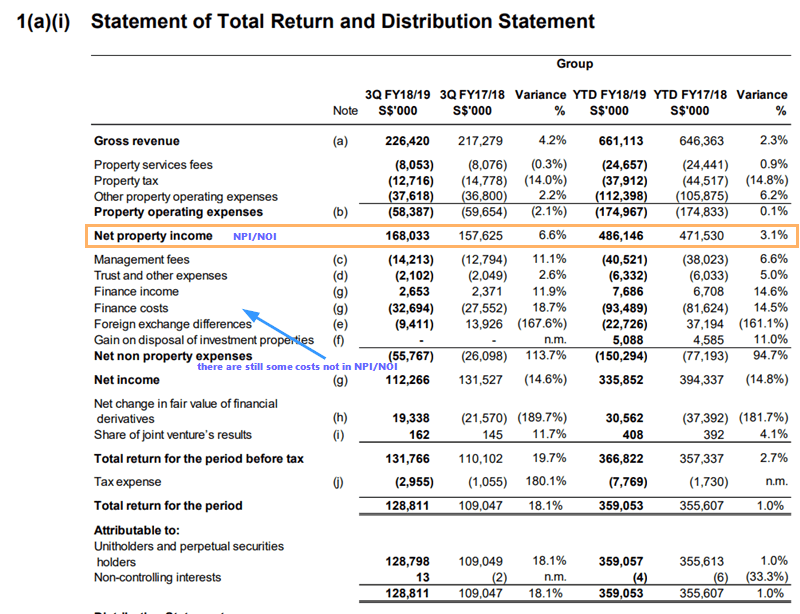
You can grab their quarterly financial results, or annual financial results and go to Statement of Total Return and Distribution Statement.
I have highlight the net property income. Note what is factored into the computation. Note also what other expenses are not included. So it does not mean that if Ascendas REIT here earned $168 mil in NPI this quarter, the shareholders get $168 mil. There are some more costs.
Using the CAP Rate in Valuation
The formula for CAP rate is as such: CAP Rate = NOI / Value of the Property.
If you rearrange things: Value of the Property = NOI / CAP Rate
Cap Rate is one of the ways that we use to value specific properties. It is sort of the equivalent of the Price Earnings Ratio (PE).
You have a stock that earns $2.00 in earnings per share. Suppose based on the quality of the company and comparables, they are trading at 20 times PE.
Your stock should be value at $2 x 20 = $40 per share.
Similarly, your property earns $24,000 a year in net property income. The prevailing market CAP rate for this property is 5.5%.
Thus the value of our property is $24,000/0.055 = $436,363.
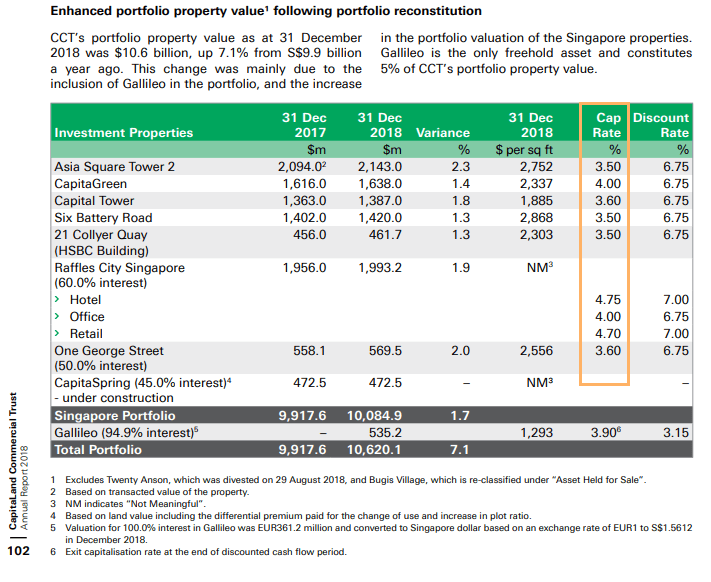 The table above is taken from Capitaland Commercial Trust’s 2018 annual report. It updates shareholders the value of the individual property. Corresponding to each property, we can see the CAP rate that have been applied to value each of the property.
By publishing the CAP Rates, it let’s shareholders compare the CAP rate used against the prevailing market cap rate, or the CAP rate used by other REITs, property companies.
It let us know whether the CAP Rate is conservative or not.
Does CAP Rate Account for the Growth Component in a Property?
In the previous section, we say: Value of the Property = NOI / CAP Rate
Now, we know that the formula that we used to value a stock to perpetuity is: Intrinsic Value of a Stock = Annual Income per share / (Expected Rate of Return – Growth rate of Annual Income per share)
Notice the uncanny similarity:
- Value of the Property and Intrinsic Value of a Stock
- NOI and Annual Income per share
We can say that: CAP Rate = (Expected Rate of Return – Growth rate of Annual Income per share)
The expected rate of return, in a stock investing terms is often called the required rate of return or the discount rate. To put it simply, it is the return that you got to give me, for me taking on this risk of putting my money in a risky asset over a period of time where my money will lose out to inflation.
The growth rate is the average compounded growth rate of a stock.
Generally, this way of valuing stock works better if the business produces recurring income. This fits properties very well since income can go up and down but generally can be rather consistent.
So if we have: CAP Rate = (Expected Rate of Return – Growth rate of Annual Income per share)
It goes factoring in some Growth Expectations.
Suppose we compare 2 properties:
- The Market Cap rate is 5.5%
- Property A has a CAP Rate of 5%
- Property B has a CAP Rate of 6%
- Both have the same NOI
The difference is 0.5% from the market CAP rate.
On first glance, Property B looks to be undervalued compared to the market or Property A.
We can interpret it as Property A have higher growth prospect than the market and Property B has a lower growth prospect than the market.
The greater the growth rate the smaller the CAP rate.
But is this really the case?
How can do You Make Money from This?
That is your job. Your job as an investor is to find the inefficiency in how the market priced the property and what you think it could generate.
By this we mean (building on the previous example)
- to find the Property B that trades at a CAP Rate of 6% but the growth expectation is not negative but either zero or positive (expected return is 8% but the growth is not -2% but either 0% or +1-2%)
- to find the Property B that trades at a CAP Rate of 6% but the growth expectation that is LESS negative than the market thinks
You make money through the inefficiencies.
So in one simple number it covers the current expected yield of the property, or group of property and its compounded growth rate. The difficulty here is to determine how much is the yield and the growth embedded within this figure.
Suppose you own this portfolio of properties AND you are able to be entrepreneur about it, what you want to do is:
- buy when CAP Rates are high then sell at a lower exit CAP Rates
- buy when CAP Rates are low or fair but not super low, and sell them at even lower CAP Rates
- during your holding, do your best to expand the net property income and thus expand your CAP Rates. Your property value will go up.
Other Factors that Impact the CAP Rates
Here are some other factors that impact the CAP Rates:
- Lease Duration. Longer lease duration generally command lower CAP rates because uninterrupted cash flows tend to behave more like a long term bond.
- Credit Quality. Tenants with higher credit quality will drive CAP rates lower
- Discounts to replacement cost. Properties that are above market rents valued far in excess of replacement cost are likely to command higher CAP rates. This is because the cash flow would be difficult to replicate when the lease expires (think of the sale and lease back properties which are sold and leased back at higher rent. Once the seller leaves, the new tenant would not rent at such a high price)
- Geographical or Legal Barriers to Entry
Using the CAP Rate to Compare a Specific Property or group of properties against the Market
Suppose you have a portfolio of properties, similar in nature (same geographic, pretty similar specs) and they trade at a CAP Rate of 6%.
The market CAP rate for this group of properties is at 5%.
One conclusion you can draw is that the properties looked undervalued. You might have a good deal there.
However, the more sensible thing to do is take a look at the quality of this portfolio versus what is available on the market.
If the quality is worse off than perhaps there is a reason the CAP Rate is at 6%. It is just a weak portfolio. There is no inefficiency there.
If you are sophisticated and deemed this portfolio to be as good quality as what is available in the market, then there might be some inefficiency there.
The portfolio might be having a required rate of return of 5% but a growth rate of -1%. If you put it into the equation you get 5%-(-1%) = 6%.
Comparing Against another of a Similar Nature
It goes without saying that you can compare against another similar property you intend to purchase.
One trades with a CAP rate of 5%, the other 7%.
The 7% one is obviously more attractive, but that is just the numbers.
You can then take a look at the details to see if there are inefficiencies here.
Some inefficiencies might be that likely no one wants to rent the condo at this current condition.
But if you improved on it, people will rent. So by doing something, you can eliminate part if not all the negative growth rate.
Checking Out What is Available Out there
Real estate companies such as Knight Frank, JLL, CBRE frequently published market data on these properties.
So what they show you is the:
- prevailing CAP rates for different regions
- whether the rates are going up or down
** Click to view larger image **
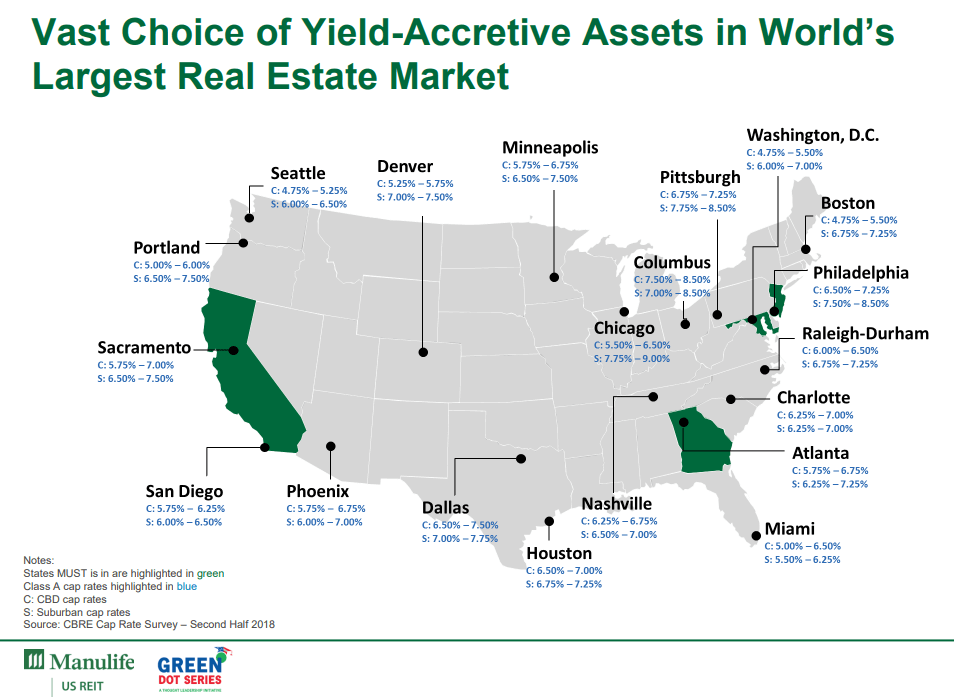
The above slides was taken from Manulife US REIT report. It’s purpose is to show you that, for the Class A specification of property that they are looking for, what is the market CAP Rates of the CBD and Sub-Urban properties out there.
This is so that you can contrast to their current dividend yield of 6.8% to 7%, whether they can find dividend yield accretive properties to purchase.

** click to view larger table **
The table above is taken from CBRE’s 2H 2018 Office CAP Rate survey. So we can see the various movements in various sub markets.
It goes to show how big some markets are, that they can break into different tier cities, different class of properties, in CBD or sub-urban. What is interesting is that they listed out the CAP rates for stabilized properties, and value-add properties. This let us know some the cap rates you can get if you take a property that is not so up to date, and you value add work on them, what is the kind of CAP rate that you could get.
Do you Compare the Dividend Yield of Your REIT to the Market CAP Rate?
I do not think so. Let me try to explain.
You can go into the financials of your REIT to find the net property income and divide by the value of the portfolio of properties.
That will give you the CAP Rate of the portfolio.
You can probably use this to compare against the market CAP Rate.
What it tells you is whether your portfolio, if it is similar nature to that market, is above or below the market CAP Rate.
If the quality is not too bad, then this portfolio might be undervalued (based on this)
However, the dividend yield of a REIT, is paid out of the total income available for distribution, or something like the cash flow yield of the company.
It includes a lot of the things we talked about before that is not in the NOI/NPI such as interest expense, additional taxes, REIT managers management fees.
Secondly, your REIT’s value might trade above or below the worth of that portfolio of properties on book value.
Given these 2, it is not exactly an apples to apples comparison.
As mentioned, what is more useful is whether given the current dividend yield of your REIT, are there assets in the market that would be dividend yield accretive.
For example, if your healthcare REIT trades at a dividend yield of 5% and in the market you can find high quality healthcare facilities selling at a CAP rate of 7%, we know that there is a lot of potential for future growth through acquisitions there.
CAP Rates and Interest Rate Correlations
According to CBRE, there is a rather strong correlations between real interest rate and CAP Rates.
There will always be a spread between real interest rate and CAP Rates.
Note they say Real Interest Rate not Nominal.
They gave a good example:
- Property A has a value of $2,000 with net operating income (NOI) of $100 in year one and a CAP rate of 5%.
- If inflation is 2% and the NOI of Property A keeps up with inflation, then the NOI of Property A will be $102 a year later.
- With a cap rate of 5%, the property is priced at $2,040.
Viewed another way, the owner of Property A has achieved a 5% return over and above inflation. In other words, the cap rate is a real rate of interest, and therefore directly related to the rate of interest provided by banks less expected inflation. – CBRE
But they go on to add that:
Real estate typically provides a higher real rate of interest than do banks because of the risks and costs associated with owning real estate. This spread of cap rates has some cyclicality, but is relatively constant in the long term, reflecting the stable nature of real estate as factor of production.
They gave a very good equation for us to understand the relationship:
CAP RATE = Real Interest Rate + Spread
Spread = f (expected rent growth, debt availability, performance of other assets)
So based on this equation:
- if the expected rent growth is low
- the debt availability is low
- performance of other assets (their total return) is higher
Than you would expect this spread to be very thin. The CAP Rate will be close to the real interest rate.
This also means it is a place to get out.
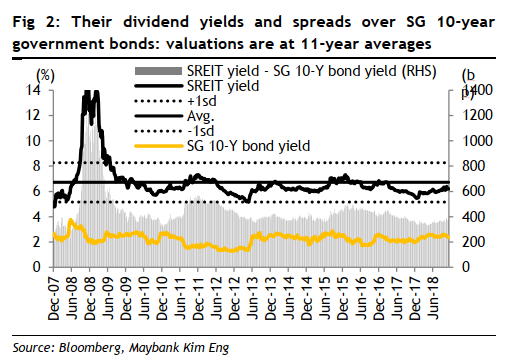
This is perhaps why in a lot of property analysis reports, they often compute the dividend yield minus 10 year government bond yield spread (in this case is the shaded area behind).
It should be noted that this is not CAP Rate, nor real interest rate. However, the concept is applicable.
A small spread versus historical would show that there is very little tailwinds for the property sector or segment.
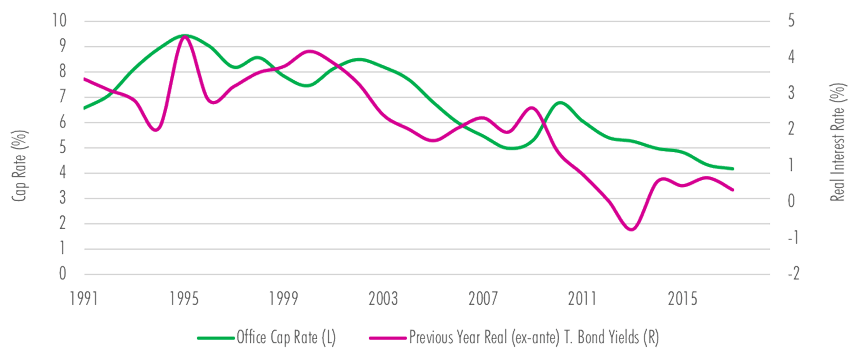
US CAP Rates and Interest rates. CBRE/Macrobond, NCREIF, August 2018
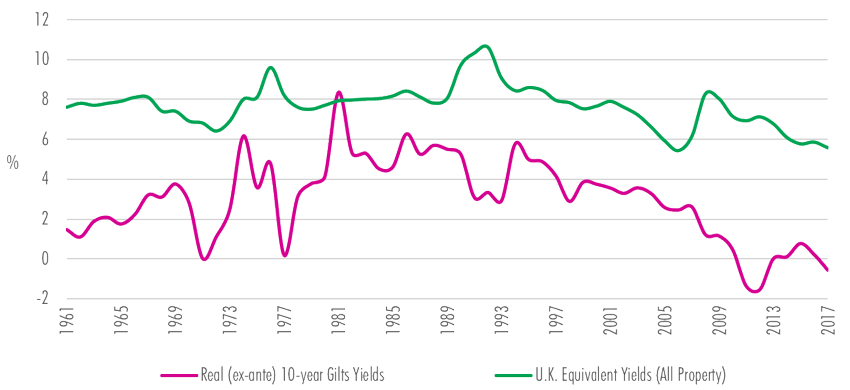
UK PROPERTY YIELDS AND REAL ESTATE INTEREST RATES.CBRE/Macrobond, MSCI/IPD, August 2018
You realize that the spread in US can be rather small, and there are times when the CAP Rates is below the previous year’s Treasury Bond yields. The UK data shows a better spread, and a 1 to 1 relationship as well, except for some very turbulent times in the 1970s.
CBRE’s data shows a similar relationship with Japan and Germany’s real interest rates as well.
In a study of US net property index CAP Rate versus the 10 year treasury bond yields from 1993 to 2016, it was shown that the correlation between CAP Rate and government bond rates is not exactly 1.0 but closer to 0.70.
This means that there may be other factors at play that changes the whole equation.
What they realize a big factor is actually the GDP growth.
Debt cost do go up
Real estate investors seek net cash flow at the end of the day when they are finding deals. The equation is net cash flow = net operating income – debt expense. If your debt expense go up, net cash flow is going down.
So in a rising interest rate environment, if the debt expense is going up, the net operating income must go up. So we need to see a CAP rate expansion.
Thus in a rising interest rate environment, we should see the CAP rate expand. The correlation might not always be high.
Since interest rate nowadays are historically low, we should be expecting some CAP rate expansion over time.
For those who are investing in properties (such as private investors or funds), if you are purchasing properties, you should be buying based on a more conservative CAP Rate. Rather than expect a low cap rate and reason the future growth is there.
How do We Hedge Our Risks to Have Margin of Safety?
If we are in the position of an investor, who is trying to protect our risks this can be a rather difficult endeavor.
We do not know where the market is going.
However, we might know that, roughly in reference to historical:
- how is the CAP Rate versus the real interest rate in a historical perspective
- relatively where are we in terms of borrowing costs
- where we are in the credit cycle. By this we mean whether there are more relaxed lending standards or more stringent
You could tell where we roughly are, and how vigilant or more risk seeking we should be.
If the sentiments that are more dire, as a investor we should be more risk seeking and vice versa.
With regards to CAP Rate, as a buyer you would want to:
- If you know the market CAP rate is 5%, put in some buffer to the CAP rate, value the price you would purchase it at a lower price. This means that you use 5.5% and 6% in the valuation
- Buy properties that you know you can value add, and lift the net operating income by a lot. This will expand your CAP rate while you are holding it such that even if the market CAP rate shoots up, your property CAP rate will match up well to it
- choose not to buy and wait
Final Things to Remember
- CAP Rates are like PE ratio. It is a means to compare between two assets, whether similar or not
- CAP Rates do not include a lot of other expenses that you will still incur
- It is more meaningful to compare the CAP Rates of properties of similar nature than when they are wildly different
- CAP Rates in different regions would be different, since the nature of them are different as well
- CAP Rates intrinsically factors in a growth component, but it is not so obvious
- It does not mean that the higher the CAP Rates the more attractive the property is. The quality of the property, tenants, lease, geographical barriers are some of the things you need to evaluate
- CAP Rates work better for stabilized buildings with a longer lease duration. If the property’s lease is due next year and the rent is far above market rent, the rental growth might be very negative
- CAP Rates have a strong correlation to real interest rates
- As an investor, your job is to prospect and find properties, or portfolio of properties that have inefficiencies
I write more on REITs. You can read them in the Learning about REITs below:
Do Like Me on Facebook. I share some tidbits that is not on the blog post there often.
Here are My Topical Resources on:
- Building Your Wealth Foundation – You know this baseline, your long term wealth should be pretty well managed
- Active Investing – For the active stock investors. My deeper thoughts from my stock investing experience
- Learning about REITs – My Free “Course” on REIT Investing for Beginners and Seasoned Investors
- Dividend Stock Tracker – Track all the common 4-10% yielding dividend stocks in SG
- Free Stock Portfolio Tracking Google Sheets that many love
- Retirement Planning, Financial Independence and Spending down money – My deep dive into how much you need to achieve these, and the different ways you can be financially free
Kyith is the Owner and Sole Writer behind Investment Moats. Readers tune in to Investment Moats to learn and build stronger, firmer wealth foundations, how to have a Passive investment strategy, know more about investing in REITs and the nuts and bolts of Active Investing.
Readers also follow Kyith to learn how to plan well for Financial Security and Financial Independence.
Kyith worked as an IT operations engineer from 2004 to 2019. Currently, he works as a Senior Solutions Specialist in Insurance Start-up Havend. All opinions on Investment Moats are his own and does not represent the views of Providend.
You can view Kyith's current portfolio here, which uses his Free Google Stock Portfolio Tracker.
His investment broker of choice is Interactive Brokers, which allows him to invest in securities from different exchanges all over the world, at very low commission rates, without custodian fees, near spot currency rates.
You can read more about Kyith here.
- New 6-Month Singapore T-Bill Yield in Late-April 2024 to Drop to 3.70% (for the Singaporean Savers) - April 18, 2024
- Golden Nuggets from JPMorgan Guide to Retirement 2024. - April 16, 2024
- Be Less Reliant on Banks and Build Stronger Capital Markets by Pushing for Better Shareholder Dividend and Buyback Yield - April 14, 2024
Chris
Tuesday 25th of June 2019
What do you mean by "The Current Valuation of the Specific Property (without any leverage)"? Isn't valuation a gauge of how much the property is worth at the moment? Why would leverage be involved?
Kyith
Monday 1st of July 2019
Hi Chris, leverage will not be involved. Someone new to investing may have come across this article thus they might not know that the property value is suppose to be without leverage.