By William J. Bernstein
Most of you have seen the nifty retirement software available from the likes of Vanguard and T. Rowe Price which provides the mathematical muscle to help you plan your retirement. Input your retirement age, expected lifespan, required annual income, rate of inflation and investment return, and hey presto, you find out that to avoid a golden years diet of Alpo you need the GDP of the average Central American republic.
Problem is, it may quite possibly be worse than that. These calculators all make the same erroneous assumption — that your expected rate of return is the same each and every year. In other words, let’s assume that the real (inflation adjusted ) rate of return of the S&P 500 will be 7% in the future. You might conclude that you can withdraw an inflation adjusted $70,000 of your $1,000,000 Vanguard Index Trust 500 IRA each and every year indefinitely, and maintain yourself with the same real income in the long run. And you’d be wrong.
It turns out that if you have rotten returns in the first decade you will run out of money long before reversion to the mean saves your bacon in later years. To illustrate this phenomenon I went back to good old Uncle Fred’s infamous coin toss, with its return of either -10% or +30%. Let’s assume that these represent real returns. If over 30 years you toss 15 heads and 15 tails you earn a compounded rate of 8.17%. (If you don’t understand why you don’t earn the average return of 10% (the average of -10 and +30), then go back and read Chapter One of The Intelligent Asset Allocator.) If you start with a $1,000,000 portfolio and roll alternating heads and tails over the 30 year period, then you indeed can withdraw $81,700 (8.17% of the initial amount) over the next 30 years before all the money runs out. However, if you are unlucky enough to roll 15 straight tails before rolling 15 straight heads, you can withdraw only $18,600 per year. Reverse the process and roll the 15 heads followed by 15 tails, and you can withdraw $248,600 per year.
This phenomenon was first brought to the attention of the investing public by Philip L. Cooley, Carl M. Hubbard, and Daniel T. Walz from Trinity University. They looked at the “success rate” of various withdrawal strategies over numerous historical periods, and came to the conclusion that only a withdrawal rate of 4%-5% of the initial portfolio value (i.e., $40,000-$50,000 of a $1,000,000 portfolio) had a reasonable expectation of success. This article can be found in the February 1998 AAII Journal. You can also obtain a lucid explanation of their work as well as their “success tables” on Scott Burns’ excellent website.
On a more basic level, however, you can apply a much simpler acid test to your withdrawal strategy: What would happen if the day you retired marked the beginning of a long, brutal bear market, say on January 1, 1966, and you lived for another 30 years, until 12/31/95? For the first 17 years (1966 to 1982) the return of the S&P 500 was a paltry 6.81%. By gruesome numerical coincidence, this was identical to the rate of inflation for the period, making the real stock return for the whole 1966-82 period zero. The return for the next 13 years (1983-95) was spectacular, bringing the real return for the whole 30 year 1966-95 period up to 5.3%, not too far below the historical norm of 7%.
I next constructed an all equity portfolio consisting of 80% S&P 500 and 20% US small stocks, and mixed this with 5 year treasuries. I assumed that one began the period with $1,000,000 and then calculated results of various withdrawal rates from the following mixes: 100% stock, 100% bond, and 75/25, 50/50, and 25/75 mixes of both. The results are plotted below. The all stock portfolio is the thickest line, and the thinner the line, the less stock. Again, it is important to realize that the amounts on the y axes are in inflation adjusted 1995 dollars. This is the simplest and clearest way of performing retirement calculations.
First, let’s look at withdrawing 7% of the initial amount, or $70,000 (inflation adjusted), per year:
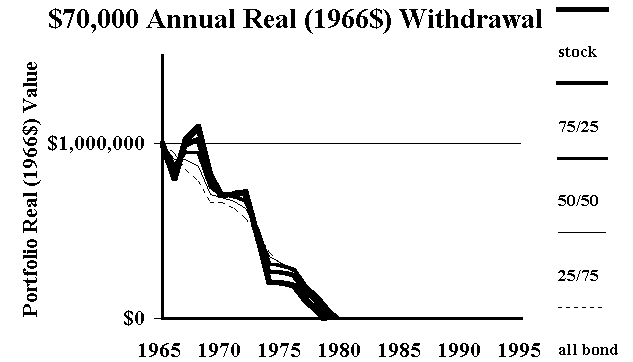
As you can see this is an unmitigated disaster, particularly for the all stock portfolio. All 5 portfolios run out of money in about 15 years, and it really doesn’t matter what mix you use. The great bull market beginning in 1984 came far too late to save even the most patient investor.
Next, $60,000 and $50,000 (5% and 6% of the initial amount):
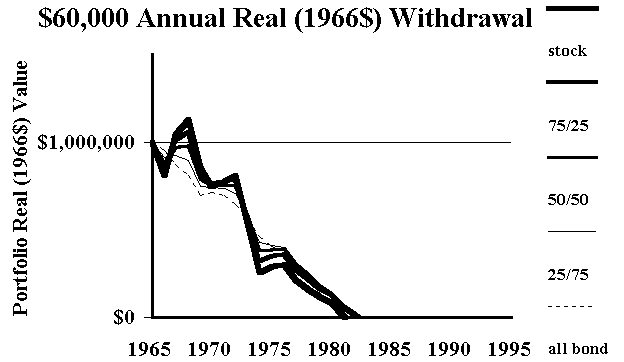
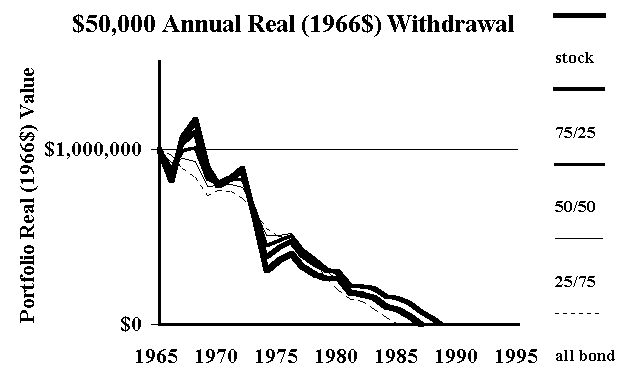
You still wind up in the alms house, but only after 20 and 25 years. Holding a bit of bonds seems to stretch the money a bit further.
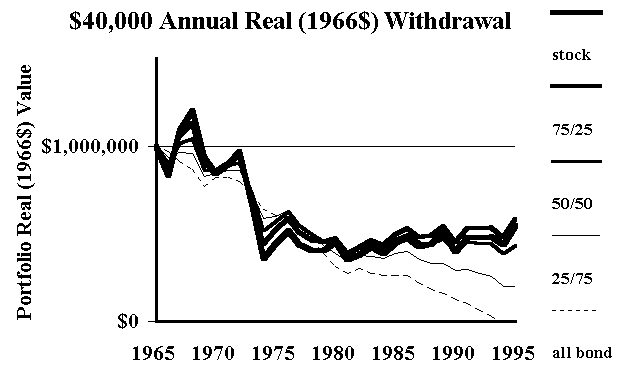
Only at $40,000 (4% of the initial amount) withdrawal rates do things look a little less grim. All strategies holding 50% or greater stock survive the 30 year period. However, even this route was one wild ride.
What devastates the above scenarios is the withdrawal of a predetermined inflation adjusted stipend from a portfolio already ravaged by the market. What happens if instead we withdraw a fixed percentage (as opposed to a fixed amount) of our principal? In other words, if we start with a nest egg of $1,000,000, and withdraw 7% each year, we will begin withdrawing at a rate of $70,000 per year. If our principal then falls 50%, we are left with only $465,000, so we can now only withdraw payments at a rate of .07 x $465,000 = $32,550 per year. This approach has the advantage that we never run out of money, although the stipend amount will fall dramatically in some years. I’ve plotted annual income for 5% and 7% constant percentage withdrawals below. Whereas the plots above showed the real residual portfolio wealth after constant real withdrawals, the below plots show the annual stipends from a constant percentage withdrawal:
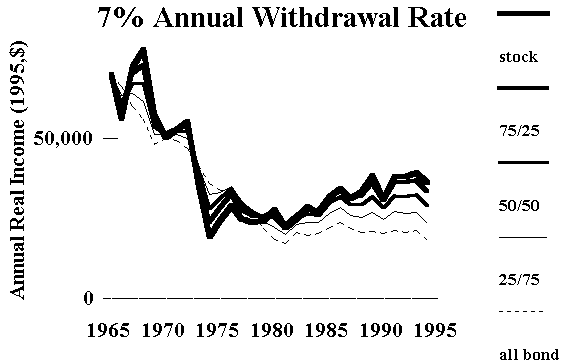
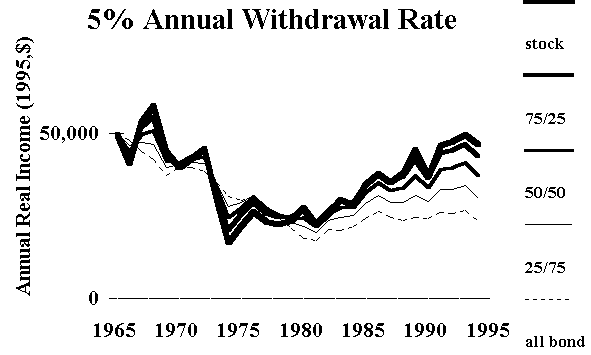
Note that for a constant percentage withdrawal the all stock portfolio does better than the mixed portfolios. This is because one is effectively “value averaging” into a falling market by reducing one’s withdrawals when stock prices are low. But the 7% withdrawal rate is still unacceptable, with withdrawals of less than $40,000 in all the later years. The 5% rate works better, but one still has to tolerate a stipend amount which dramatically fluctuates with market conditions. Even this strategy is not for the faint of heart. It produced a real $50,000 income in 1966, which rose to a real $58,803 in 1968, fell to a real $19,965 in 1974, rising back to a real $46,904 by the end of 1995.
Although historical market analogizing can be both embarrassing and dangerous to one’s wealth, this market looks an awful lot like 1966. It would behoove anybody with an investment horizon stretching another 30 years to consider the 1966-95 as a useful reality check.
One point cannot be made often enough — when you retire, are you going to be withdrawing a fixed inflation adjusted amount on a regular basis, or are you going to be withdrawing a fixed percentage of your portfolio? This is not a semantic fine point. If you need a fixed amount, plan on withdrawing no more than about 4% of your starting amount in inflation adjusted terms. A fair dollop of bonds won’t hurt in this situation.
If you can be more flexible and spend a fixed percentage of your nest egg each year, then you can indeed keep you entire retirement stash in stocks and spend 5% annually. Just remember that your stipend will likely fluctuate wildly over the decades of your retirement. Keep a few cans of Alpo in the cupboard if you decide to go this route .
Kyith is the Owner and Sole Writer behind Investment Moats. Readers tune in to Investment Moats to learn and build stronger, firmer wealth foundations, how to have a Passive investment strategy, know more about investing in REITs and the nuts and bolts of Active Investing.
Readers also follow Kyith to learn how to plan well for Financial Security and Financial Independence.
Kyith worked as an IT operations engineer from 2004 to 2019. Currently, he works as a Senior Solutions Specialist in Insurance Start-up Havend. All opinions on Investment Moats are his own and does not represent the views of Providend.
You can view Kyith's current portfolio here, which uses his Free Google Stock Portfolio Tracker.
His investment broker of choice is Interactive Brokers, which allows him to invest in securities from different exchanges all over the world, at very low commission rates, without custodian fees, near spot currency rates.
You can read more about Kyith here.
- New 6-Month Singapore T-Bill Yield in Late-April 2024 to Drop to 3.70% (for the Singaporean Savers) - April 18, 2024
- Golden Nuggets from JPMorgan Guide to Retirement 2024. - April 16, 2024
- Be Less Reliant on Banks and Build Stronger Capital Markets by Pushing for Better Shareholder Dividend and Buyback Yield - April 14, 2024