In 2014, as my wealth approaches $500,000, I started exploring whether it is possible to spend $24,000 a year and have that $500,000 last for a long time.
If you divided $24,000 by $500,000, that is a withdrawal rate of 4.8% in the initial year.
If I adjust that $24,000 every year by inflation (e.g the inflation last year is 6%, so next year you spend $25,440 and if the inflation is 4.5% this year, you increase your spending from $25,440/yr to $26,584/yr), I realize spending a 4.8% in the initial year and then constantly adjusting it by inflation is going to blow up that $500,000.
So my article was on the Variable Withdrawal Strategies that allow me to spend $24,000/yr in the initial year, be flexible and systematically adjust my spending, so that it can make $500,000 workable.
You can read Variable Withdrawal Strategies for Financial Independence- The Definitive Guide here >>
I review my post, and realize majority of what I wrote 5 years ago still stands. Perhaps there are some little things to add on.
But what I cannot do was to simulate how do these tactical flexible spending tweaks will look like in some of the absolute worse market sequences.
Do they actually work? Is it significant enough?
I was introduced to this United Kingdom based company Timeline App by a friend. Timeline was the brain child of Abraham Okusanya.
I have first got acquainted with Abraham when I read his work on whether it makes sense to keep a cash reserve buffer (You can read my profile of his post here).
I gave Timeline App a trial and realize that it is a godsend to a retirement nerd like myself. To financial planners, I think it helps them risk manage their client’s plan. But from the reviews I get, most people think this is confusing and unusable.
TimelineApp is like a sword forged by Dragon Glass or Valyrian steel. If you do not know what it is for, you would not see the value in it.
For those who knows, man…. its the only solution to a very terrible problem.
So I decide to test some of my variable withdraw strategies and see how well they work.
It will also give you a glimpse of the potential of Timeline App.
What I will do is:
- Present the base case of a 5% initial withdrawal rate that is constantly inflation adjusting. This is higher than the popular 4% safe withdrawal rate
- Then I increase the allocation to equity
- Then tweak how we handle increase in purchasing power
- Then tweak how we step up or step down our spending depending on how well our portfolio do
- I also showed if we take a more conservative 3% initial withdrawal rate
- The effect of higher investment fee on your retirement spending plan
To be fair, I evaluated many variable withdrawal strategies, but I am not going to present all of them. Each of them are rather interesting on their own. But I realize they do almost the same thing, and have the same downsides. You make your money last, but you lose purchasing power. It is to what degree that happens.
So let us get down to it.
The Baseline Scenario: A 5% Initial Withdrawal from Your Portfolio and Constantly Adjusting for Inflation
I started planning with the following permutation:
- I have a wealth of $500,000 that I wish to live off of
- I want to see if I can start off spending $25,000 for the first year of my financial independence. This is 5% of my initial wealth of $500,000 (we call this an initial withdrawal rate of 5% versus the 4% withdrawal rate)
- For subsequent years, I increase and decrease the $25,000/yr based on the inflation rate. If inflation is +4%, it will be the previous years’ spending x (1-0.04) and if inflation is -2%, then it is previous years’ spending x (1-(-0.02)). I will maintain my purchasing power (inflation adjusted)
- I invest in a portfolio of 50% Global Equities and 50% Global Aggregate Bonds
- I have factored in 0.75% total all in cost for this portfolio. This is to simulate expense ratios, commission or sales charges, investment platform asset under management and platform fees
- Global Equities is data from Global Financial Data (GFD) World Return (GFD definition here). Data extends back to 1265
- Global Aggregate Bonds is data from Global Financial Data (GFD) World Government Bond GDP-weighted Price Index. Data extends back to 1265
- The portfolio will be re-balanced once a year every year
- Assume I am 40 years old, and I need the money to last till 100 years old. That is a duration of 60 freaking long years
- In terms of withdrawal, I will withdraw evenly from my portfolio allocation. So this means that for each year, I will withdraw equally from equities and aggregate bonds
- There will be no taxes factor in
- I will adjust my withdrawals for inflation every year
- I will not implement any Dynamic spending rules. Dynamic spending rules are periodic systematic spending shifts due to portfolio and spending changes in order to ensure the wealth last longer
- No minimum withdrawal floor will be set. This means that I did not set a particular annual real spending amount say my spending will at least need to be $12,000 a year and it cannot fall below that
- I factor in no government pension plans like CPF Life
So based on this permutation, can my money last till 100 years old?
This retirement is not going to end well.
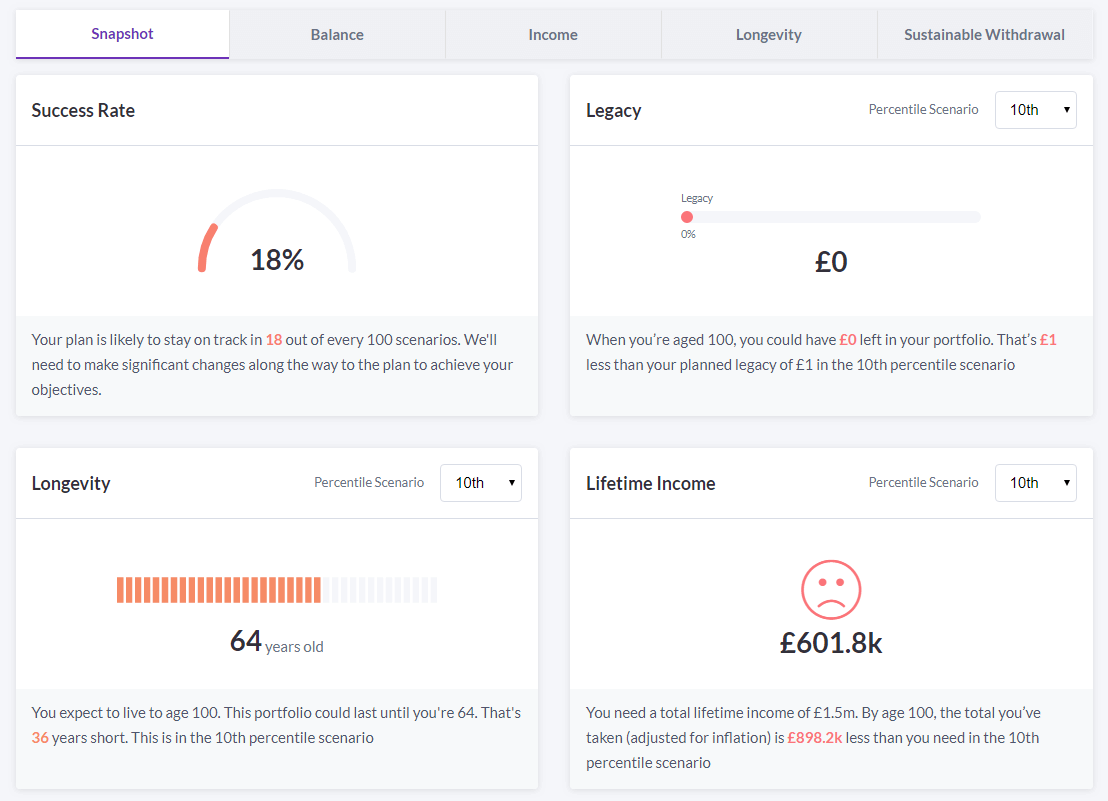
On Timeline’s dashboard, it tells me that my plan has a 18% of succeeding. I will not leave any amount on the 10th percentile (in the spectrum of possibilities, this ranked 10% out of 100%. very low but not super low in terms of possibilities. The lower the percentile the more conservative is your planning).
The portfolio will only last me for 24 years till 64 years old. I need $601,800 more than what my portfolio can provide.
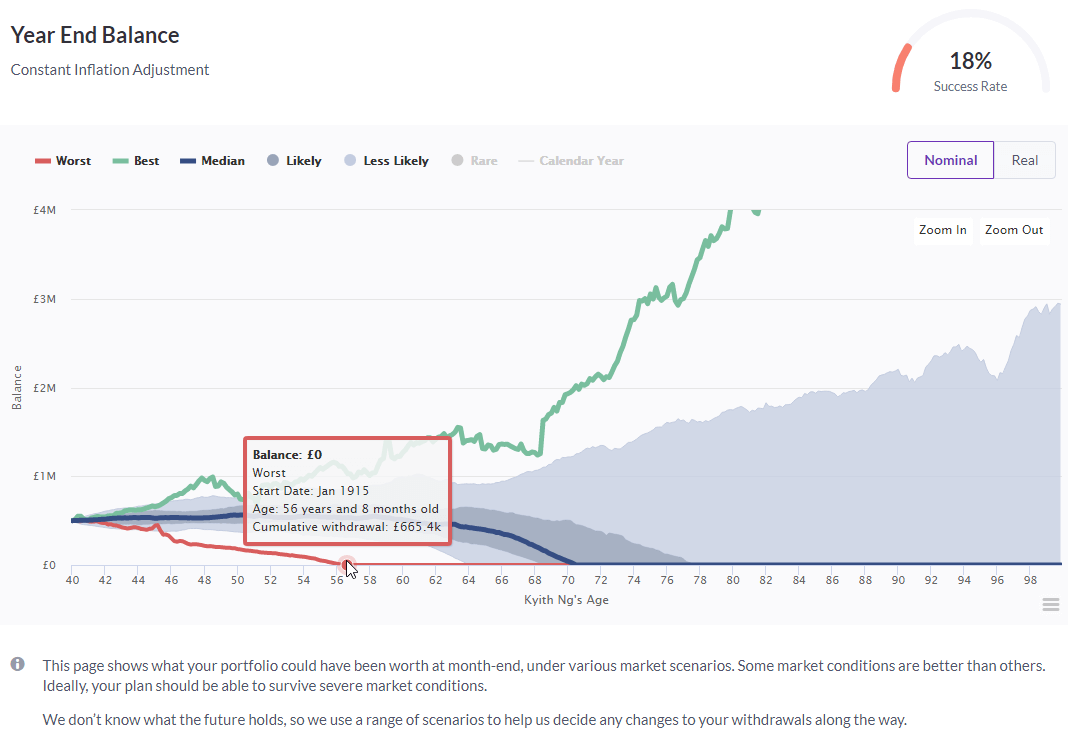
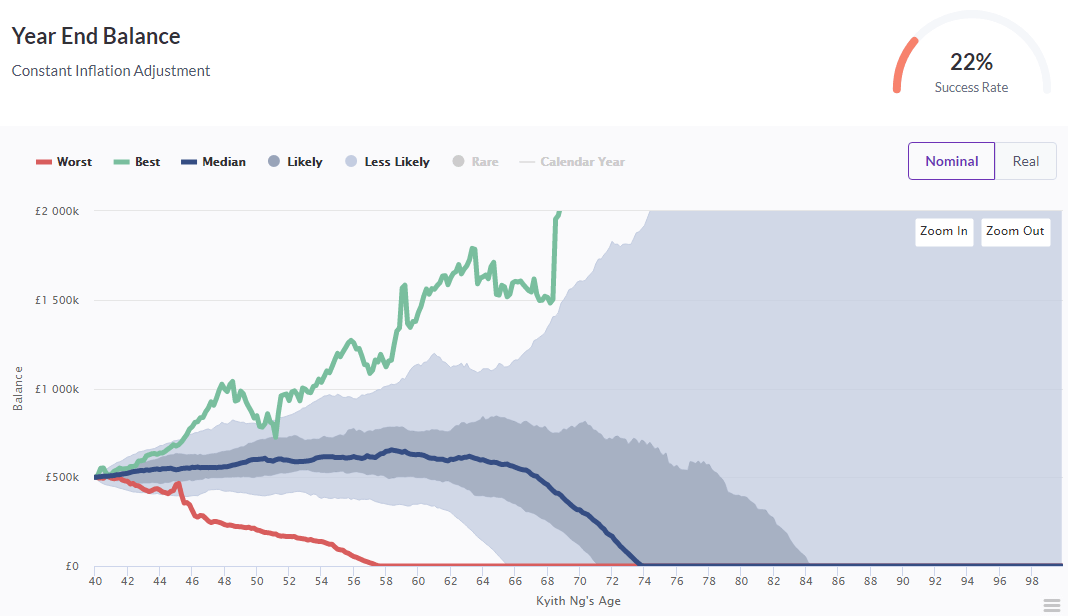
The above chart shows the progression of the nominal net worth of this $500,000.
Imagine this as a lot of you from different parallel universe all retiring at different time. One of you starts in 1915, then the next person retire at 1916, then the next you retire at 1917, and so on and so forth. Each of these retire for a 60 year period.
This simulates some of the worst case, best case, most likely, less likely scenarios.
Notice that the 1915 retiree will run out of money at age 56 or 16 years later, if you withdraw this way. The 1921 retiree will have his wealth grew to at least $8 million! On the medium basis, that retiree will run out of money at age 70 years old.
To have your money last, at an initial 5% withdrawal rate, is very difficult.
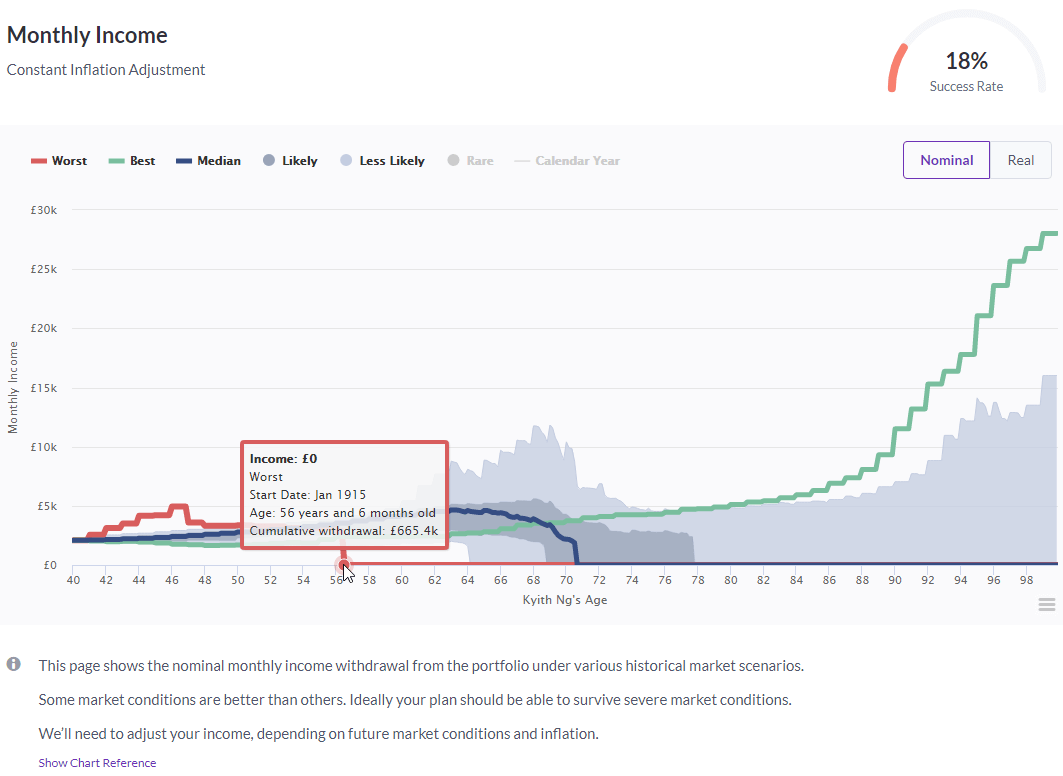
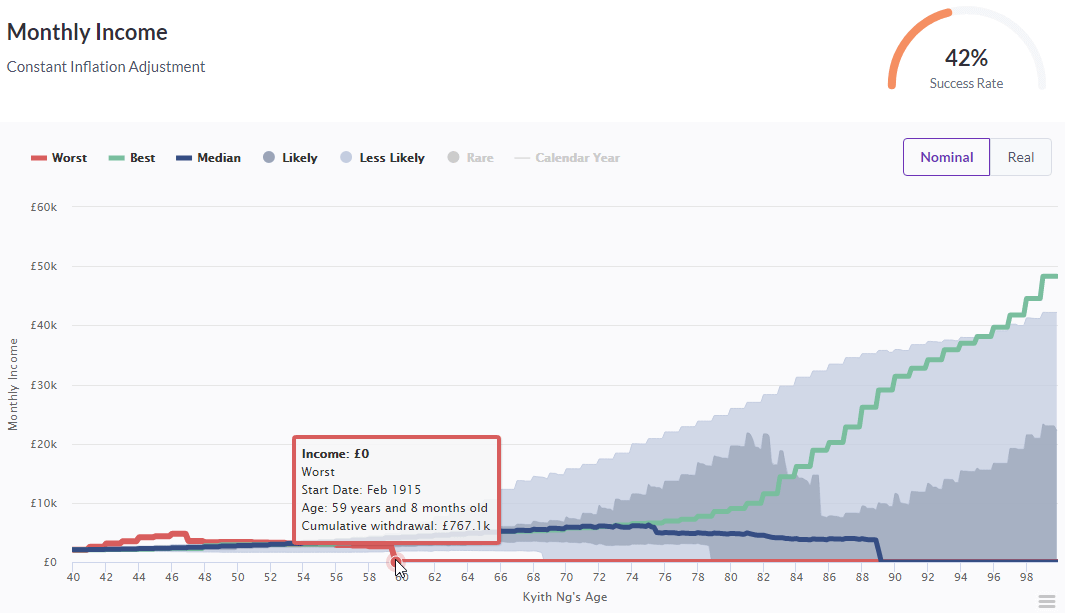
The chart above shows something similar, but this is the monthly income of that $2083 over time. Again at age 56, you will run out of money in the worst 60 year period starting in 1915.
Your money in the least likely situation will last till 64 years old or 24 years.
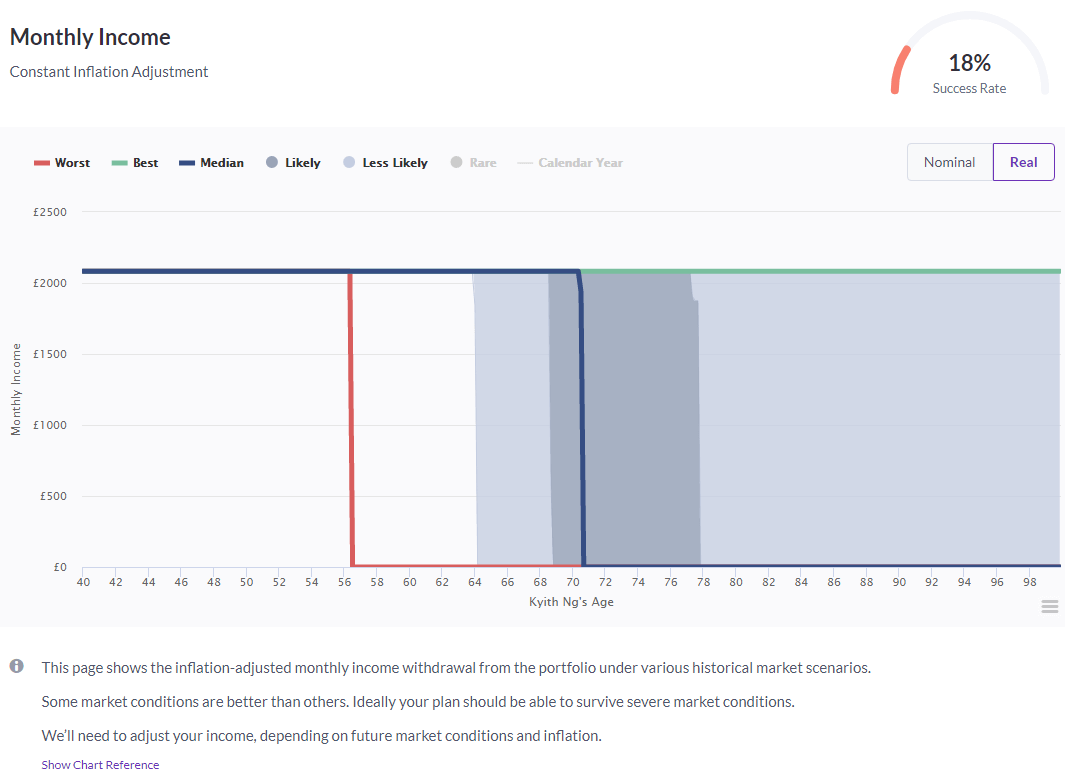
Timeline allows you to visualize the monthly income in real terms.
The way to think about real terms is that, you would want the purchasing power your income of $2083/mth to be preserved over the 60 years. So you can see as time progresses, the money stayed at $2083 until they ran out of money at 56 years, 64 years, 69 years, 71 years or so.
In order to preserve your purchasing power, you eventually ran out of money earlier.
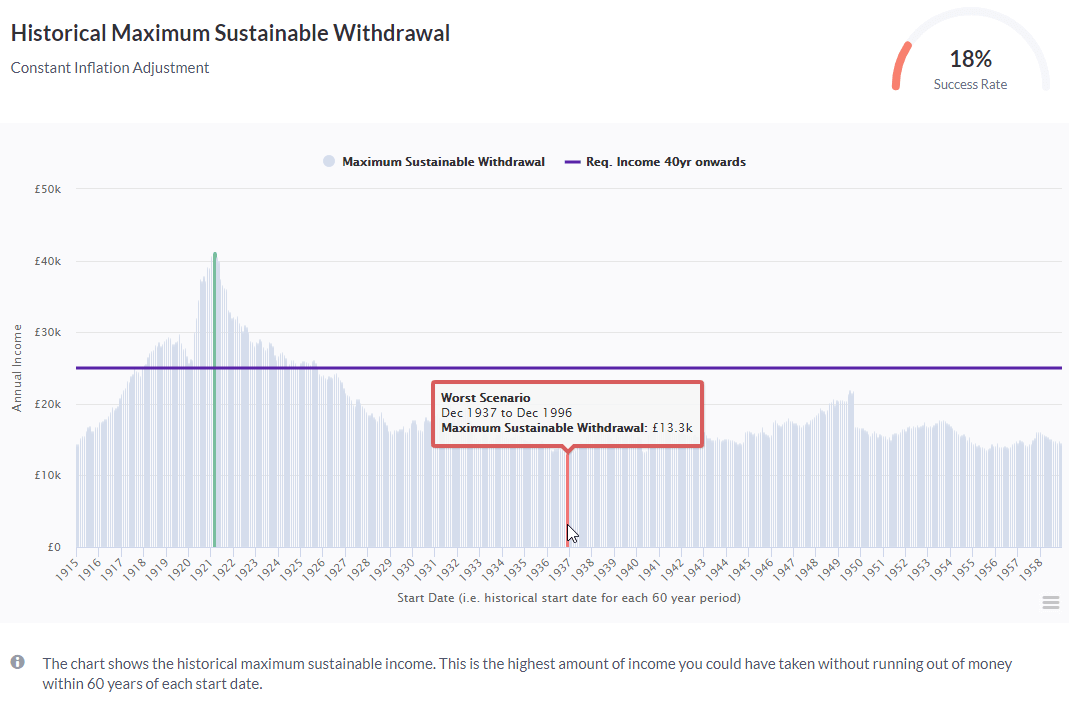
Finally, timeline allows you to see the maximum initial withdrawal rates of the different retirees (the 1915 retiree, the 1916 retiree, the 1917 retiree and so on)
The best case is the retiree in 1921, where you can spend $40,000/yr for the first year and adjust onward (that is like a 8% initial withdrawal rate). The worst one is the 1937 to 1996 retiree where you can only take $13,300/yr (2.66% initial withdrawal rate). The line shows your requirement to have $25,000/yr.
Suffice to say: If you wish to
- withdraw 5% initially
- preserve your purchasing power
You will run out of money early in the least likely scenario, if you wish to be do that.
Portfolio Adjustment: Increase Stock Allocation
To survive a longer than 30 years retirement, we need to ensure that the overall rate of return of the wealth portfolio is high enough.
And this can be achieve by increasing the equity allocation versus bonds.
When you invest in more equity, you take on more market volatility, and thus you hope that you get compensated with a higher return.
When you take on more equity:
- Your compounded returns are higher. This is good for the portfolio in retirement
- The negative draw down of your portfolio is higher. This is not good as you suffer from higher sequence of return risk
From my research, the optimum amount to increase is not to increase to 100% equity. When you increase your allocation to so much equity, the safe withdrawal rate actually went down instead of up. The main reason is the volatility works against you.
So in this case let us change our Timeline Wealth Portfolio Allocation to 80% World Equity and 20% World Bonds.

The success rate improved from 18% to 42%.
But in terms of balance, in the worst case you still run out of money in 20 years. In the 10th percentile you ran out of money 28 years later.
This one does not change much but for the median scenario, instead of running out at 71 years old, the median scenario ran out at 89 years old.
The least likely scenario improved but it still last less than 30 years.
Tactical Flexible Spending: Adjust your Spending for Inflation
Now what if you wish to adjust your spending by not always adjusting for inflation?
In Timeline, it allows you to simulate that.

Timeline provides a few kinds of famous systematic inflation adjustment rules:
- the first one is not to adjust for inflation. This does not seem like a good idea
- the second one is the default which is to adjust for inflation every year
- the third one was developed by financial planner Jonathon Guyton and his friend Klinger. It is that if the year is up, you adjust for inflation. If it is a negative portfolio return year, you do not adjust
- this one is to set a upper and lower bound to how much inflation adjustment that you are subjected to
- the last one is financial planner David Zolt’s inflation minus adjustment. It means that if inflation is 3% and you set X to -1%, the resultant inflation is 2%. If inflation is 5%, the resultant inflation is 4%
I decided to go with Guyton Inflation adjustment and add this to my 80% equity / 20% bond allocation.
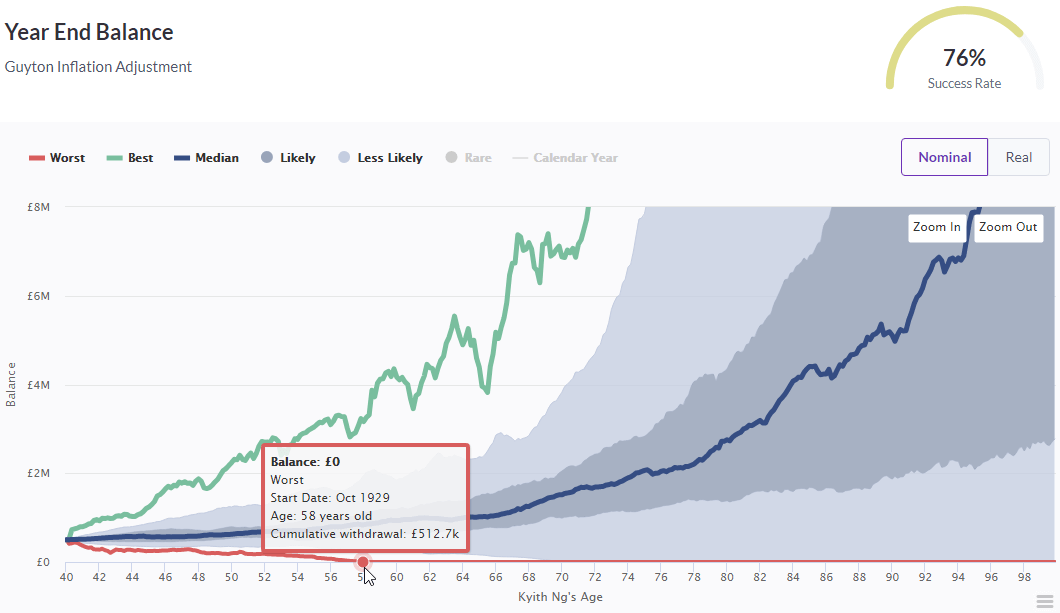
The success rate improved further from 42% to 76%.
However, we see that in the worst case (this time is 1929 instead of 1915. Notice that it changes…) you still ran out of money around 58 years old. The least likely case we ran out in 69 years again.
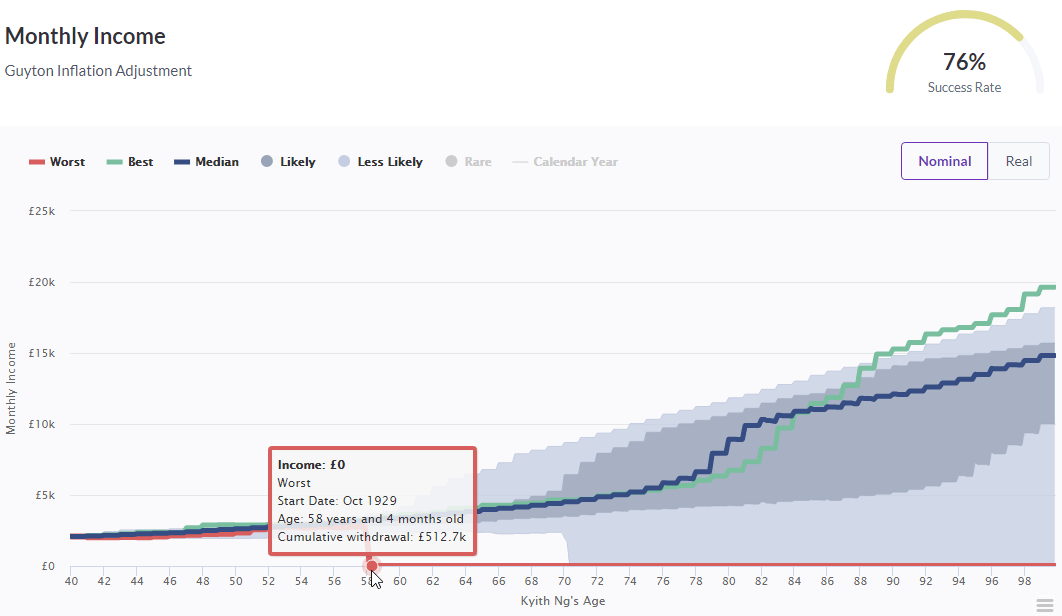
In terms of monthly income, the worst and least likely scenario did not improve, but the likely cases is doing much better in nominal terms.
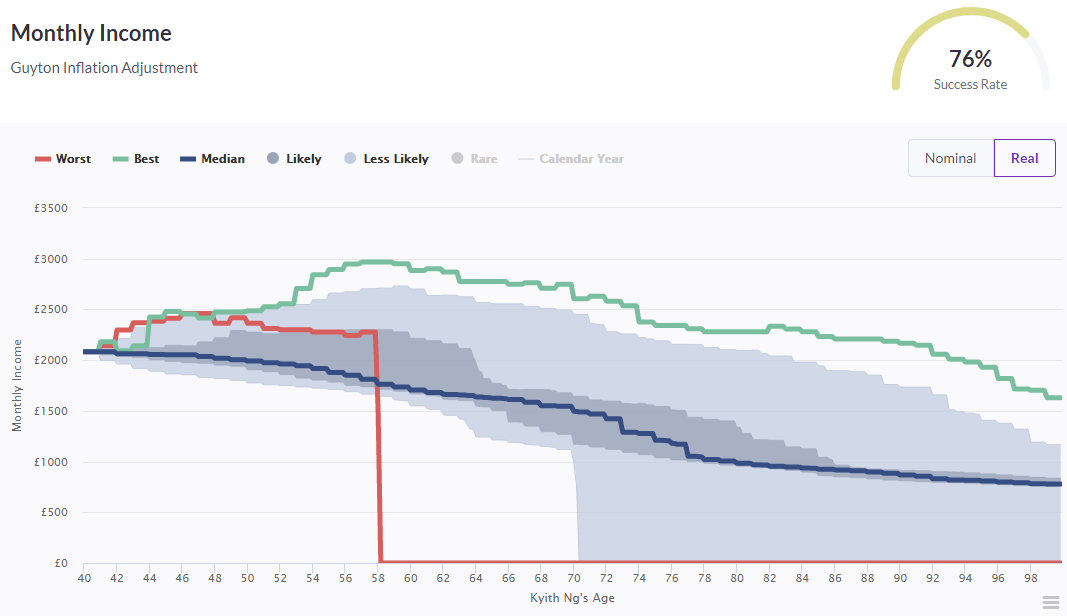
It is only when you see the real purchasing power of your monthly income that you see the difference.
Notice the dark blue line going down, as opposed to it staying flat at $2083/mth.
When you only adjust for inflation when the portfolio is up, you start losing purchasing power.
In the median case, your purchasing power went down 50% to around $1000/mth.

The lowest initial safe withdrawal rate turns out to be still around $15,800. We seemed to not be able to run away from this. But the problematic period shifted to the period of 1929 to 1988.
Tactical Flexible Spending: Capping Maximum and Minimum Spending
Now that we adjust for inflation, we can also see if we can systematically shift our spending when times are good and when times are bad.
I always have this kind of thinking:
- In what world would our spending be this consistent?
- Would you increase your spending if your portfolio takes a severe hit, or would you still continue to increase your spending?
- If your wealth is accumulating more than normal, will you choose to spend more?
Timeline provides the following spending rules:
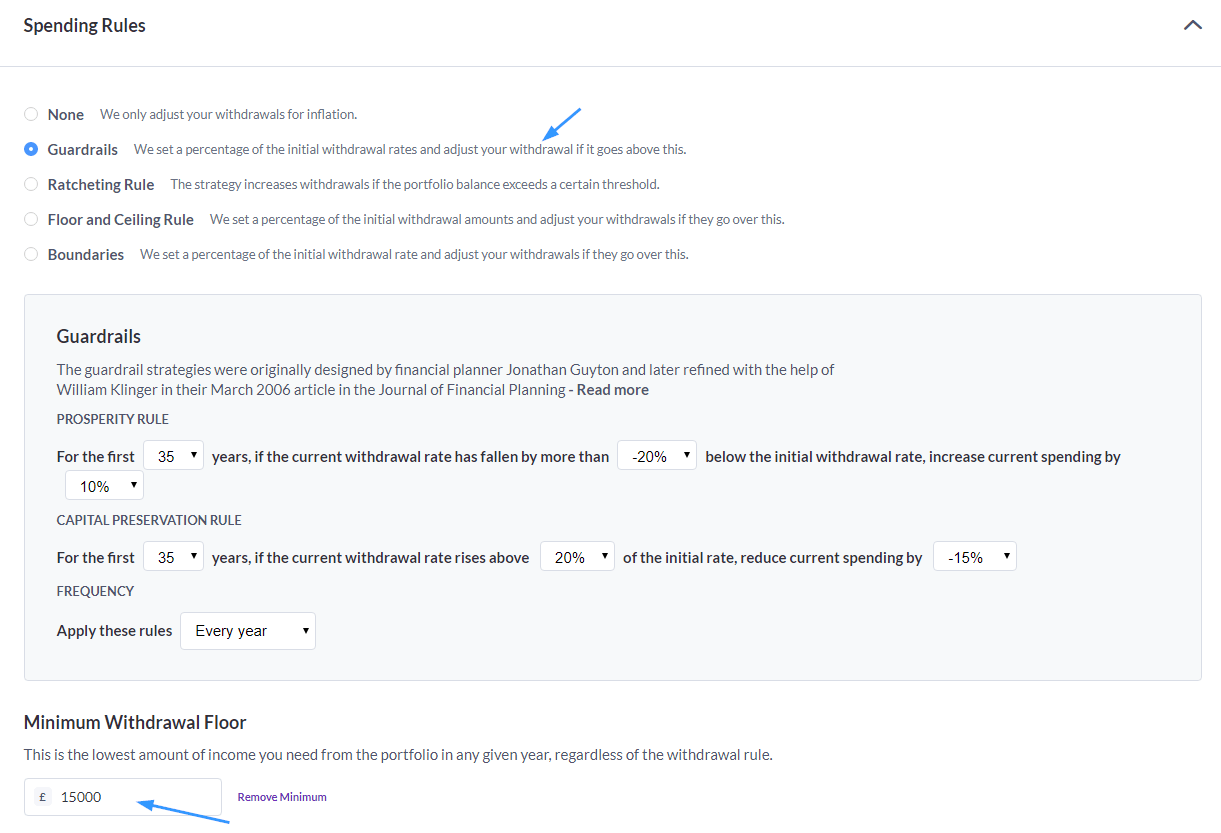
- The default is to not have a spending rule
- Guardrails is what I chose and I will explain more later
- Ratcheting is a rule that came from Michael Kitces. You increase your spending if your wealth exceeds a certain threshold
- Floor and Ceiling rule was implemented by William Bengen, the father of the 4% Rule. Instead of the rigid 4% rule, his actual implementation is more of a gradual adjustment if the wealth portfolio increase and decrease more than normal
- Boundaries is pretty similar to Guardrails
Jonathan Guyton and William Klinger came up with the Guardrails to adjust your withdrawal when the wealth portfolio, relative to your current year spending is too much or too little.
- Prosperity Rule. I set that for the first 35 years (out of 60 year of retirement) if the current withdrawal rate has fallen by more than 20% below the initial withdrawal rate, I increase the current spending by 10%
- Capital Preservation Rule. I set that for the first 35 years if the current withdrawal rate has rose by more than 20% above the initial withdrawal rate, I decrease the current spending by 15%
So if we replace with actual numbers:
- Prosperity Rule. If the current withdrawal rates goes below 4%, we adjust spending by +10%
- Capital Preservation Rule. If the current withdrawal rates goes above 6%, we adjust spending by -15%
We then set a minimum withdrawal floor of $15,000/yr or $1,250/mth.
This is to be safe that, I preserve a minimum purchasing power so that I do not starve too much.

The success rate improved from 72% to 95%.
We still have one year where the money ran out earlier than expected. But this was pushed to 90 years old which is great.
What is significant is you would notice the 10% percentile or least probable was able to grow over time.
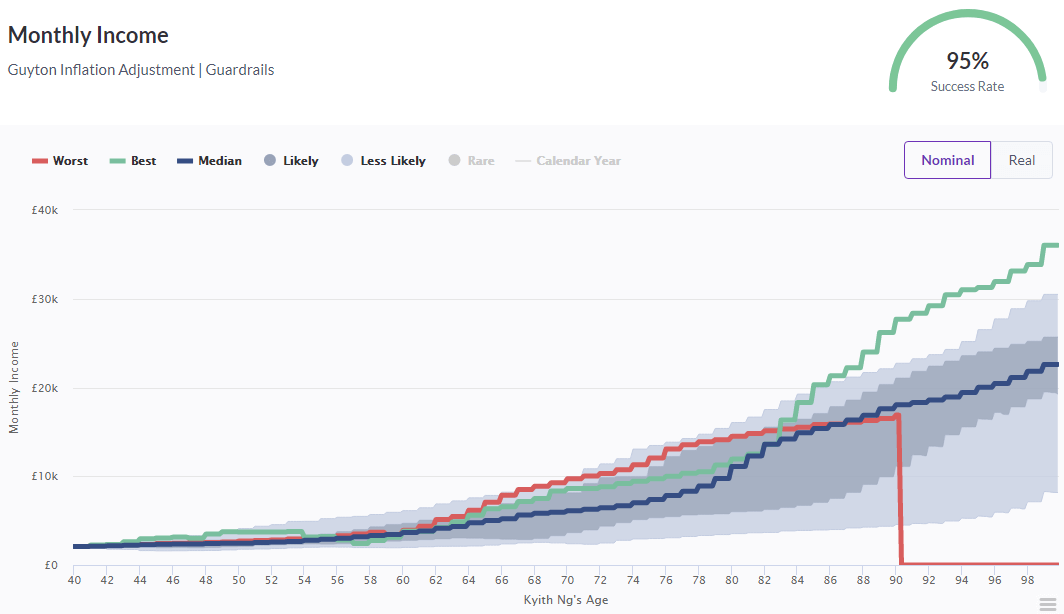
In terms of nominal monthly income, other than the worst year, the 10th percentile was able to grow that monthly income much more.

However, if we look at the real terms, your purchasing power gets cut to $1,250/mth.
As early as 55 years old or 15 years later, the real spending income went down to $1,250/mth.
The realization is that while you try to spend 5% of the initial withdrawal, you spent 75% of the time spending only $1,250/mth.
And that might not be what you are looking for. However, in most of the situations, your money would enable you to last a 60 year retirement.
If you compare this real monthly income chart to the nominal monthly income chart before, the nominal monthly income chart shows that the income is still going up. It is just that based on purchasing power, it is not going up as fast as it should. You wonder that is good enough for you.

In terms of the maximum sustainable withdrawal rate, you could pretty much have an adequate initial withdrawal rate of at least $25,000/yr.
Quick Recap: How we Bumped up the Success from 18% to 95%
If we spend a 5% initial withdrawal rate, it is not going to give us a monthly income that last past 63 years old or 23 years in the 10th percentile scenario.
So we have to make adjustments.
These are the adjustments:
- Asset allocation shifts: Shifting to 80% Global Equities from 50%
- Tactical Flexible Spending: Only increase the last year annual withdrawal income if the wealth portfolio have a positive year. If not do not increase
- Tactical Flexible Spending: For the first 35 years out of 60 years of retirement, if the current withdrawal rate is plus or minus 20% of the initial withdrawal rate, we do a +10% or -15% change to the last year annual withdrawal income
What you are able to achieve is:
- Your wealth portfolio in the 10th percentile situation would last till 100 years old
- Your real income drops to $15,000/yr, the minimum income you set, for 75% of your retirement
If you are flexible and make adjustments, you can achieve higher success rates.
However, that also depends on what do we mean by success.
A Flexible Systematic 5% Initial Withdrawal Rate may Equal to a Rigid 3% Constant Inflation-Adjusted Initial Withdrawal Rate
Remember that I set the Minimum Withdrawal Floor to $15,000/yr.
That is the floor income constrain that I need in order for my plan to work out well.
How does this apply to real life?
In financial independence planning, or retirement planning in general, I would recommend you to break your expenses into two groups:
- Essential Expenses or Survival Expenses
- Non-Essential Expenses
If you are able to split the $25,000/yr into the essentials and non-essentials, you can focus on ensuring the portfolio is able to sustain the essential expenses and if it does better to take care of the non-essential expenses, then it is a bonus.
However, if you see that for 75 percent of a 60 year retirement, you can only spend on the essentials, then this might equate to a 3% initial withdrawal rate that we do not adjust our spending with inflation and changes to the value of the portfolio.
If you are lucky that you did not end up in less than the 10th percentile, you will actually have more to spend on the non-essentials.
By doing this, it fits a financial independence scheme known to us as achieving Financial Security.
So if we set:
- $500,000 initial wealth portfolio
- 60 year retirement
- a 80% equity allocation and 20% bond allocation
- $15,000/yr initial withdrawal income (this is a 3% initial withdrawal rate)
- Adjust for inflation like the 4% Rule to preserve purchasing power and do not have spending rules such as the Guyton Capital Preservation and Prosperity Rules
Let us see what we can get.

The success rate to achieve a minimum income to fulfill your essential expenses is high. In the 10th percentile situation, your wealth portfolio might eventually grow to $18 mil.
That leaves around a lot of room to spend.
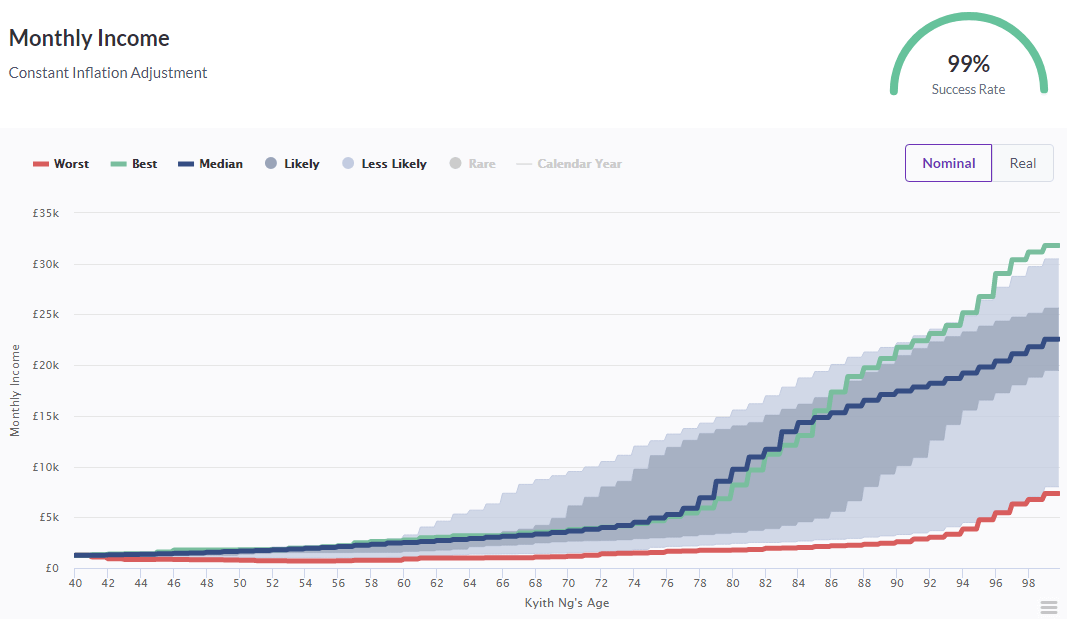
The nominal monthly income profile looks good as well. In some likely scenario, your spending that you can spend on non-essential expenses will also be available.

The real income is constant throughout the 60 years at $1250/mth.

This 3% initial withdrawal rate coincides very closely to the worst case scenario of 1929 to 1988 and you can only withdraw a constant inflation-adjusting $15,700/yr.
This looks good. Let us move on to the next one.
How Much is the 0.50% Fee Difference to Your Plan?
One thing I realize is that in real life there is a cost to investment, which usually is not factored into research.
So that is why I use a 0.75% Fee Cost.
But how big is the impact?
Suppose we go back to the first scenario where our success rate is 18%.
Let us use only 0.25% Fee Cost.
We use a 0.25% Investment Fee
And this is the previous result:
With Investment Fee of 0.75%
You improve the success rate from 18% to 22%. But if you look at the 10 Percentile Least Likely Scenario, doing this improved your result by 1 year.
That is not going to matter that much.
Cost Matters in Investing.
The difference here is 0.50%.
This is probably the difference between you DIY Invest in Ireland Domiciled UCITS ETFs with the most cost efficient broker at Interactive Brokers versus investing in Dimensional Fund Advisers with MoneyOwl or Endowus.
One could give you a less than 0.30% total all in cost while one is 1.25% total all in cost.
That 0.95% is massive and you might say Kyith is bias to equate a difference of 0.95% to that of 0.50% difference.
If I work out a difference of 0.75% instead of 0.50%, the success rate just bumped up 2% from 22% to 24%.
In the 10th percentile least likely scenario, your money runs out at 66 years old versus the 64 to 65 years old in the previous scenario.
Cost Matters, but the other factors of
- asset allocation
- how much you withdraw
- your ability to be flexible
Matters more when it comes to spending down your money systematically.
Summing Up: What Can We Learn to Better Plan for a Sustainable Spending Plan
I think the TimelineApp is great to help us simulate how risk seeking or how risk adverse our plan is.
By going through this exercise, we hope that you can see a few things:
- Your wealth portfolio is going to be volatile
- To have more rate of return, you need to allocate to more equities
- That would mean your portfolio is going to be more volatile. At some point the volatile makes it less desirable to increase your allocation to equity
- You are not going to just earn a consistent average return of 6%, 6%, 6%, 6%, 6%, 6% every year. The reality is that your portfolio goes through booms, busts, or normal sequences
- There are certain sequence that are pretty unfortunate
- If you withdraw too much during the start of these negative sequences, your money is not going to last
- If you withdraw too much from your portfolio in general, your money is not going to last!
- There are systematic tactical shifts that you can do with your spending
- They make your wealth portfolio last longer
- But you lose purchasing power over time
- It is a tug of war between how much purchasing power you wish to preserve and how much you want your wealth to last
- Cost matters in investing. But in the grand scheme of spending down your wealth, there are other things that is the priority
- Split your expenses to the essentials and non-essentials
- If you aim to be conservative and guarantee your essential spending and not your non-essentials you may have greater levels of success
- If your initial withdrawal rate is less than 3%, it means you have more wealth. When you have more wealth, your plan becomes more conservative. There is a fine line and that fine line perhaps is around 3% to 3.25% initial withdrawal rate
- Based on my research, this is my ranking of challenges and their impact
- Not knowing what is a conservative, optimistic and average withdrawal rate for yourself
- You basically withdraw too much. The math in some conservative scenarios do not work out
- Rigid and Stubbornness, together with Blind Faith
- Negative sequences (related to portfolio volatility)
- For 30 year periods, inflationary busts (those years starting in 1966 to 1969)
- For longer periods, deflationary busts
- Low rate of returns (due to high fees, low eventual returns and asset allocation mix)
- Not knowing what is a conservative, optimistic and average withdrawal rate for yourself
Timeline I feel, may not be appropriate to be put in front of clients.
Advisers sell based on a good narrative. And when they cannot craft a good narrative that they can control, it becomes problematic.
I feel that Timeline is good for clients to risk manage their recommendations to their clients. It allows them to simulate their recommendations and determine whether, in the grand scheme of things, if we put the plan through a lot of historical sequences, whether it is optimistic or less optimistic.
I think that, every client or retiree wants to have a safe plan.
And for many people a safe plan, is one prepared by a competent, trusted adviser.
So they equate a safe plan with the adviser. This is a problem because the adviser does not want to confuse the client, so they use certain models that their clients would understand better.
What happens is that, the clients are convinced their competent adviser have created a safe plan.
But their idea of safety and the actual reality is very far apart. So when shit hits the fan, the client feels not very safe.
The adviser will have to coach the client through the ordeal.
Or the adviser needs to come up with excuses.
My philosophy is that you want to know how much margin of safety you have, what are the average realities, you go understand the topic yourself as much as you can. When you stare at bleakness, at realities, at what are some of the typical situations, you do not have much negative surprises.
Timeline helps to do that because it shows that you can end up with no money or $20 mil in 60 years time.
This is the freaking reality.
Then you can find that competent adviser that can give you a
- Low volatility enough return plan
- Understand these challenges and have a fundamental sound plan to systematically spend down your money
My take: I think winning 4D (a Singapore lottery) is easier.
One thing I appreciate a lot about Timeline is the data set available.
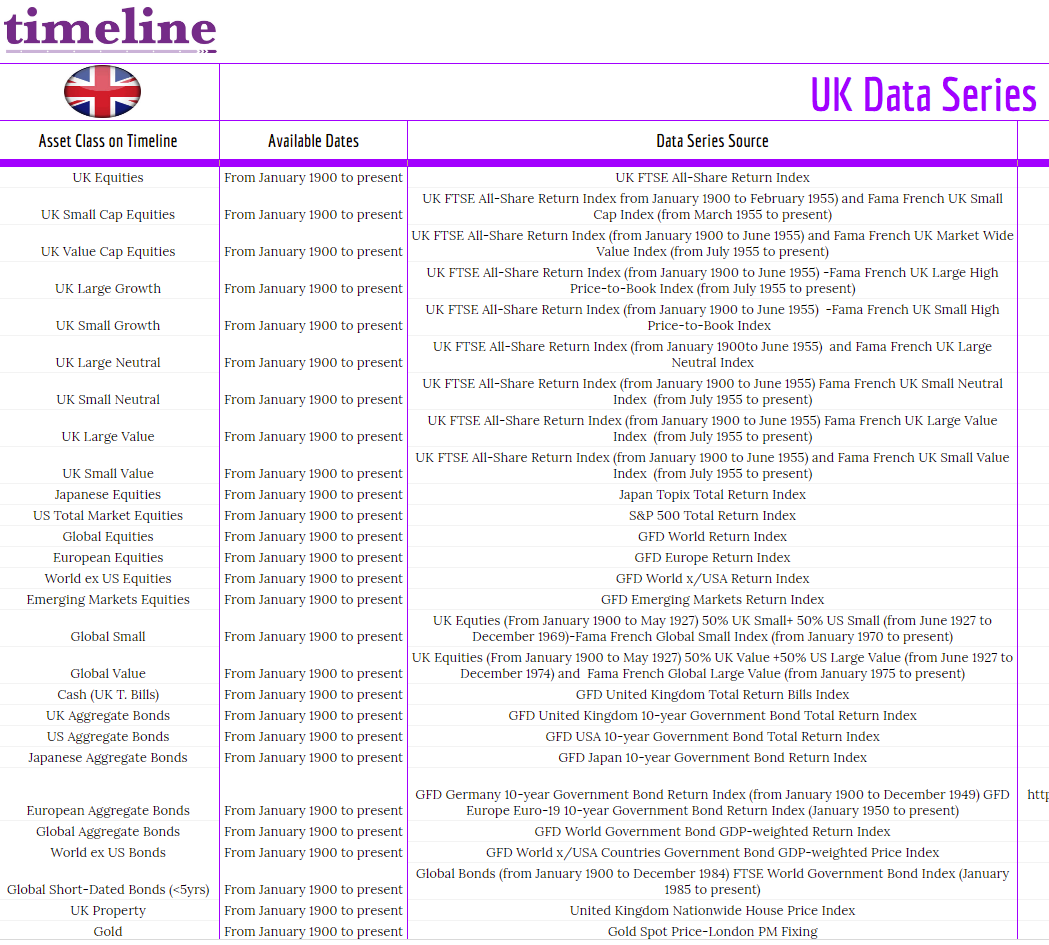
In the table above, you can see that if you specify certain asset allocation, where is the data taken from.
TimelineApp is not Free and is meant for Financial Advisers. For those adviser friends, you might wanna check it out.
I would probably do one or two more shorter ones. Let me know if there are some scenarios you may want me to consider.
My other Retirement Planning stuff can be found in my Retirement Planning section below:
Do Like Me on Facebook. I share some tidbits that is not on the blog post there often. You can also choose to subscribe to my content via email below.
Here are My Topical Resources on:
- Building Your Wealth Foundation – You know this baseline, your long term wealth should be pretty well managed
- Active Investing – For the active stock investors. My deeper thoughts from my stock investing experience
- Learning about REITs – My Free “Course” on REIT Investing for Beginners and Seasoned Investors
- Dividend Stock Tracker – Track all the common 4-10% yielding dividend stocks in SG
- Free Stock Portfolio Tracking Google Sheets that many love
- Retirement Planning, Financial Independence and Spending down money – My deep dive into how much you need to achieve these, and the different ways you can be financially free
Kyith is the Owner and Sole Writer behind Investment Moats. Readers tune in to Investment Moats to learn and build stronger, firmer wealth foundations, how to have a Passive investment strategy, know more about investing in REITs and the nuts and bolts of Active Investing.
Readers also follow Kyith to learn how to plan well for Financial Security and Financial Independence.
Kyith worked as an IT operations engineer from 2004 to 2019. Currently, he works as a Senior Solutions Specialist in Insurance Start-up Havend. All opinions on Investment Moats are his own and does not represent the views of Providend.
You can view Kyith's current portfolio here, which uses his Free Google Stock Portfolio Tracker.
His investment broker of choice is Interactive Brokers, which allows him to invest in securities from different exchanges all over the world, at very low commission rates, without custodian fees, near spot currency rates.
You can read more about Kyith here.
- New 6-Month Singapore T-Bill Yield in Late-April 2024 to Drop to 3.70% (for the Singaporean Savers) - April 18, 2024
- Golden Nuggets from JPMorgan Guide to Retirement 2024. - April 16, 2024
- Be Less Reliant on Banks and Build Stronger Capital Markets by Pushing for Better Shareholder Dividend and Buyback Yield - April 14, 2024
Life Finance
Wednesday 3rd of July 2019
Analysis and simulations like this need to get more attention, because in reality, financing a long term retirement is not as easy or rosy as financial advisors tend to make it sound. You have raised some very pertinent points: 1. You need equities for growth to sustain long term withdrawals, but equities also create a dag on returns due to the higher volatility. For example, a portfolio with 25% annual volatility (like the STI) creates a drag of -3% on annual long run returns. So here is the dilemma - without enough equities, you an't beat inflation in the long run. With equities, you need to earn an additional 3% a year on the assets to overcome the volatility drag. 2. Costs matter hugely when you are living off your portfolio. A 0.5% of assets management fee may not sound like much, but in retirement, assuming a 3.5% withdrawal rate, that is a 14% tax on your annual income!